A Venn diagram visually represents the relationships between different sets, illustrating their commonalities and differences through overlapping circles. This powerful tool helps simplify complex information, making it easier to compare and contrast data, whether in math, logic, or everyday decision-making. Explore the rest of this article to discover how Venn diagrams can enhance your understanding and problem-solving skills.
Table of Comparison
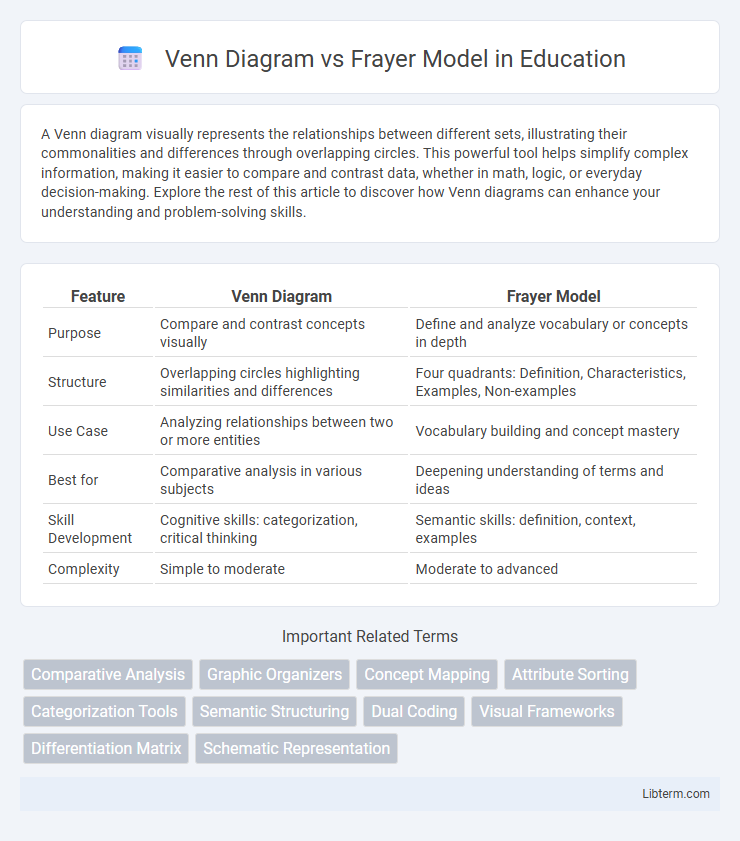
| Feature | Venn Diagram | Frayer Model |
|---|---|---|
| Purpose | Compare and contrast concepts visually | Define and analyze vocabulary or concepts in depth |
| Structure | Overlapping circles highlighting similarities and differences | Four quadrants: Definition, Characteristics, Examples, Non-examples |
| Use Case | Analyzing relationships between two or more entities | Vocabulary building and concept mastery |
| Best for | Comparative analysis in various subjects | Deepening understanding of terms and ideas |
| Skill Development | Cognitive skills: categorization, critical thinking | Semantic skills: definition, context, examples |
| Complexity | Simple to moderate | Moderate to advanced |
Introduction to Concept Mapping Tools
Venn diagrams and Frayer Models are essential concept mapping tools used for organizing and visualizing information effectively. Venn diagrams illustrate relationships and intersections between different sets, highlighting similarities and differences. The Frayer Model enhances vocabulary comprehension by breaking down concepts into definitions, characteristics, examples, and non-examples for deeper understanding.
Overview of the Venn Diagram
The Venn Diagram is a visual tool used to compare and contrast two or more sets, illustrating similarities and differences through overlapping circles. It is commonly employed in fields such as mathematics, logic, statistics, and education to organize information and identify relationships between concepts. Its clear, intuitive format aids in critical thinking and data analysis by highlighting commonalities and unique elements within datasets.
Understanding the Frayer Model
The Frayer Model enhances vocabulary comprehension by categorizing a concept into four distinct sections: definition, characteristics, examples, and non-examples, promoting a deeper understanding of term meaning and usage. Unlike the Venn Diagram that visually compares and contrasts two or more items, the Frayer Model focuses solely on expanding knowledge of a single concept within its context. This approach facilitates critical thinking and retention, especially in educational settings where mastering precise vocabulary is essential.
Key Components of Each Model
The Venn Diagram consists primarily of overlapping circles used to illustrate relationships, similarities, and differences between two or more sets, highlighting shared and unique attributes visually. The Frayer Model features a four-quadrant square divided into sections labeled Definition, Characteristics, Examples, and Non-examples, designed to deepen concept understanding through categorization. Both models serve distinct educational purposes, with Venn Diagrams emphasizing comparative analysis and the Frayer Model focusing on comprehensive concept exploration.
Visual Structure Comparison
The Venn Diagram features overlapping circles that visually represent the relationships and commonalities between different sets, highlighting both shared and unique characteristics. The Frayer Model consists of a divided four-square layout, organized into definitions, characteristics, examples, and non-examples, allowing detailed conceptual understanding. While the Venn Diagram emphasizes comparison and intersection of concepts, the Frayer Model focuses on comprehensive semantic mapping of a single term or idea.
Use Cases for Venn Diagrams
Venn diagrams excel in illustrating relationships and overlaps between two or more sets, making them ideal for comparing characteristics, identifying commonalities, and visualizing data intersections in fields like mathematics, logic, and computer science. They are particularly useful for problem-solving scenarios that require clear differentiation and categorization of shared and distinct attributes. In contrast to the Frayer Model, which focuses on vocabulary development and concept understanding, Venn diagrams serve as powerful tools for analytical reasoning and data organization.
Use Cases for Frayer Models
Frayer Models excel in vocabulary building and concept mastery by encouraging deep understanding through definition, characteristics, examples, and non-examples, making them ideal for language arts and science classrooms. They support differentiation by allowing students to visually organize complex information, improving retention and critical thinking. Comparing this to Venn Diagrams, which effectively highlight similarities and differences between two or more entities, Frayer Models offer a more detailed, multifaceted approach to individual concept analysis rather than relational comparison.
Strengths and Limitations
The Venn Diagram excels in visually comparing and contrasting multiple concepts by highlighting shared and unique attributes, making it effective for identifying relationships and commonalities. However, its limitation lies in oversimplifying complex ideas and lacking detailed definitions or contextual explanations. The Frayer Model strengths include offering a structured approach to defining vocabulary by incorporating examples, non-examples, and key characteristics, which enhances deep understanding, while its constraint is the time-intensive process and potential difficulty for visual learners who prefer spatial representation over text-heavy content.
Choosing the Right Tool for Learning
Choosing between a Venn Diagram and a Frayer Model depends on the learning objective: use a Venn Diagram for comparing and contrasting concepts, highlighting shared and unique attributes between two or more items. The Frayer Model is ideal for deepening vocabulary understanding by defining, describing characteristics, providing examples, and noting non-examples of a term. Selecting the right tool enhances concept clarity and supports differentiated learning strategies.
Conclusion: Venn Diagram vs Frayer Model
Venn Diagrams excel at visually comparing and contrasting multiple concepts by highlighting their shared and unique attributes, making them ideal for analysis involving categories and relationships. The Frayer Model focuses on defining vocabulary by breaking down the concept into definition, characteristics, examples, and non-examples, enhancing deep understanding and retention. Choosing between the two depends on whether the goal is comparative analysis (Venn Diagram) or comprehensive conceptual clarity (Frayer Model).
Venn Diagram Infographic