A concept map visually organizes and represents knowledge, showing relationships between ideas through nodes and connecting lines. It enhances understanding by breaking down complex information into manageable parts and highlighting key concepts. Explore the rest of the article to learn how creating a concept map can improve your learning and problem-solving skills.
Table of Comparison
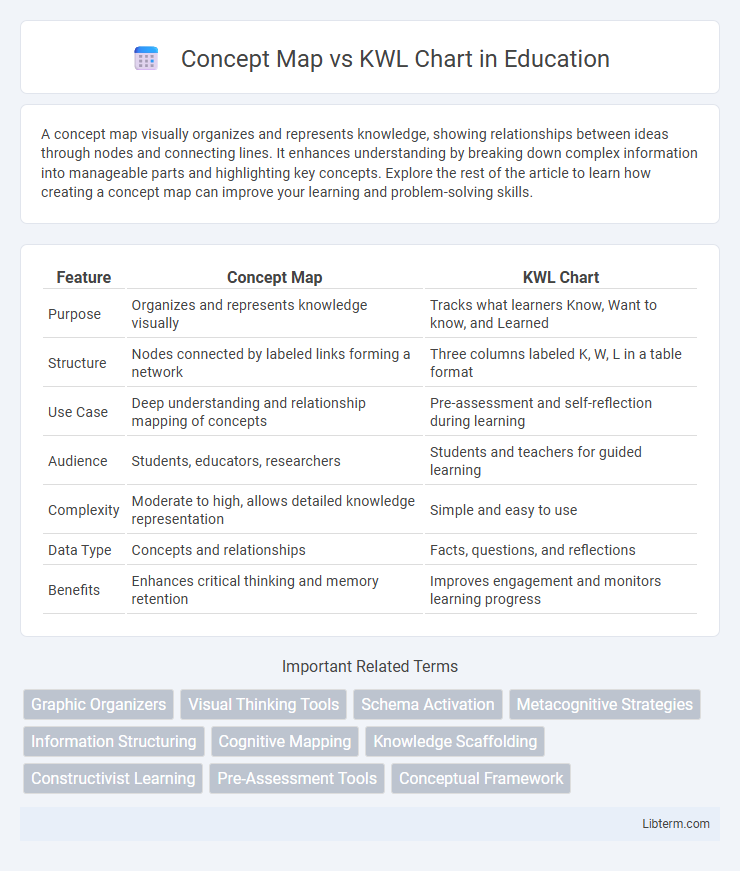
| Feature | Concept Map | KWL Chart |
|---|---|---|
| Purpose | Organizes and represents knowledge visually | Tracks what learners Know, Want to know, and Learned |
| Structure | Nodes connected by labeled links forming a network | Three columns labeled K, W, L in a table format |
| Use Case | Deep understanding and relationship mapping of concepts | Pre-assessment and self-reflection during learning |
| Audience | Students, educators, researchers | Students and teachers for guided learning |
| Complexity | Moderate to high, allows detailed knowledge representation | Simple and easy to use |
| Data Type | Concepts and relationships | Facts, questions, and reflections |
| Benefits | Enhances critical thinking and memory retention | Improves engagement and monitors learning progress |
Introduction to Concept Maps and KWL Charts
Concept maps are visual tools that organize and represent knowledge by showing relationships between concepts, often structured hierarchically with connecting lines that explain the links. KWL charts, consisting of three columns labeled Know, Want to know, and Learned, help learners activate prior knowledge, set learning objectives, and reflect on new information. Both methods enhance comprehension and retention by engaging learners in active processing of content.
Defining Concept Maps
Concept maps are visual tools that organize and represent knowledge by illustrating relationships between concepts through nodes and connecting lines, often labeled to specify the nature of each link. They facilitate meaningful learning by enabling users to structure information hierarchically from general to specific ideas, promoting deeper understanding and retention. In contrast to KWL charts, which focus on what is Known, Wanted, and Learned, concept maps emphasize the interconnectedness of concepts within a domain.
Understanding the KWL Chart Approach
The KWL Chart approach enhances comprehension by guiding learners through three stages: what they Know, what they Want to know, and what they have Learned, fostering active engagement and reflection. This tool supports metacognitive skills by encouraging students to assess prior knowledge and track learning progress. Its structured format makes it effective for organizing information and identifying knowledge gaps in various educational contexts.
Key Components of Concept Maps
Concept maps consist of nodes representing key concepts connected by labeled links that describe the relationships between these concepts, forming a hierarchical structure. The key components include concepts, linking phrases, and cross-links that integrate different segments of the map to enhance understanding. These elements facilitate visual organization and representation of knowledge, distinguishing concept maps from KWL charts, which primarily focus on what is known, wanted, and learned.
Structure and Format of KWL Charts
KWL Charts consist of three columns labeled "Know," "Want to Know," and "Learned," which guide users through their prior knowledge, questions, and new information. This straightforward, linear structure supports sequential learning and reflection by allowing students to fill in each section during different phases of a lesson. The format promotes active engagement and helps organize information efficiently by separating existing knowledge from learning objectives and outcomes.
Benefits of Using Concept Maps
Concept maps enhance learning by visually organizing information, making complex relationships between concepts clearer and easier to understand. They support active knowledge construction, helping learners identify gaps in their understanding and fostering deeper cognitive engagement. Unlike KWL charts, which primarily capture prior knowledge and questions, concept maps provide a dynamic framework for integrating new information and promoting meaningful connections across topics.
Advantages of KWL Charts in Learning
KWL charts enhance learning by actively engaging students in three phases: what they Know, what they Want to know, and what they have Learned, promoting critical thinking and self-assessment. This structured approach adapts to diverse subjects and learner levels, facilitating personalized education and better retention of information. Teachers utilize KWL charts to identify prior knowledge gaps and adjust instruction, resulting in a more targeted and effective learning experience.
Comparing Concept Map vs KWL Chart
Concept Maps visually organize knowledge by linking related concepts through labeled connections, enhancing deep understanding and memory retention. KWL Charts structure information into three columns: What you Know, Want to know, and Learned, guiding inquiry-based learning but offering less relational depth than Concept Maps. While Concept Maps emphasize conceptual relationships and holistic comprehension, KWL Charts prioritize sequential learning phases and knowledge tracking.
Choosing the Right Tool for Your Classroom
Concept maps enhance critical thinking by visually organizing and connecting ideas, making them ideal for subjects that require deep understanding and synthesis. KWL charts facilitate active reading and reflection by prompting students to list what they Know, Want to know, and have Learned, supporting comprehension in inquiry-based learning. Selecting the right tool depends on lesson objectives; concept maps suit complex topic exploration, while KWL charts excel in guiding pre-reading and assessment activities.
Conclusion: Concept Map or KWL Chart?
Concept Maps provide a structured and visual way to organize and interrelate knowledge, making them ideal for deep understanding and synthesis of complex topics. KWL Charts excel in guiding learners through what they Know, Want to know, and have Learned, promoting active engagement and reflective learning processes. Choosing between a Concept Map and a KWL Chart depends on the educational goal: use Concept Maps for comprehensive exploration and integration of information, and KWL Charts for activating prior knowledge and monitoring learning progress.
Concept Map Infographic

 libterm.com