A biomass pyramid illustrates the total mass of living organisms at each trophic level within an ecosystem, highlighting the distribution of energy and matter. Typically, lower levels have a larger biomass, supporting fewer organisms as energy transfers upward through the food chain. Explore the article to understand how biomass pyramids reveal ecosystem health and energy flow dynamics.
Table of Comparison
| Aspect | Biomass Pyramid | Inverted Biomass Pyramid |
|---|---|---|
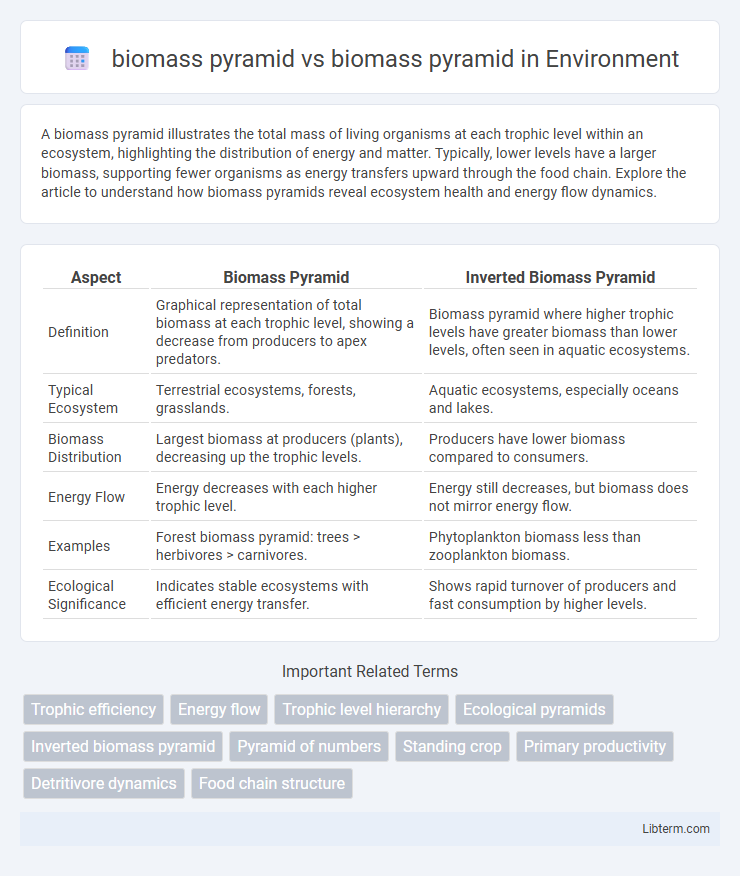
| Definition | Graphical representation of total biomass at each trophic level, showing a decrease from producers to apex predators. | Biomass pyramid where higher trophic levels have greater biomass than lower levels, often seen in aquatic ecosystems. |
| Typical Ecosystem | Terrestrial ecosystems, forests, grasslands. | Aquatic ecosystems, especially oceans and lakes. |
| Biomass Distribution | Largest biomass at producers (plants), decreasing up the trophic levels. | Producers have lower biomass compared to consumers. |
| Energy Flow | Energy decreases with each higher trophic level. | Energy still decreases, but biomass does not mirror energy flow. |
| Examples | Forest biomass pyramid: trees > herbivores > carnivores. | Phytoplankton biomass less than zooplankton biomass. |
| Ecological Significance | Indicates stable ecosystems with efficient energy transfer. | Shows rapid turnover of producers and fast consumption by higher levels. |
Introduction to Biomass Pyramids
Biomass pyramids graphically represent the total mass of living organisms at each trophic level in an ecosystem, typically decreasing from producers to apex consumers. Unlike energy pyramids that measure energy flow, biomass pyramids quantify organic material, offering insights into ecosystem productivity and biomass turnover rates. Variations in pyramid shapes, such as inverted biomass pyramids in aquatic systems, illustrate differences in organism size and reproduction rates, highlighting the dynamic nature of biomass distribution.
Understanding the Biomass Pyramid Concept
The biomass pyramid represents the total mass of living organisms at each trophic level in an ecosystem, highlighting energy flow inefficiencies. Unlike the biomass pyramid, which emphasizes mass, a numbers pyramid focuses on the count of organisms, often leading to different shapes depending on species size and lifespan. Understanding these distinctions is crucial for interpreting ecosystem dynamics and energy transfer accurately.
Types of Biomass Pyramids
Biomass pyramids depict the total mass of living organisms at each trophic level, categorized into upright, inverted, and diamond-shaped types based on biomass distribution patterns. An upright biomass pyramid shows the largest biomass at the producer level, typical in terrestrial ecosystems, whereas an inverted pyramid, often found in aquatic ecosystems, reveals higher biomass in consumers than producers due to rapid producer turnover. Diamond-shaped biomass pyramids represent systems where intermediate trophic levels have disproportionately high biomass, influenced by unique ecological interactions and energy flow efficiencies.
Biomass Pyramid Structure in Terrestrial Ecosystems
Biomass pyramids in terrestrial ecosystems typically display a broad base of primary producers, such as trees and plants, that store the most biomass compared to higher trophic levels, including herbivores and carnivores. This pyramid structure reflects energy transfer efficiency, with primary producers capturing solar energy through photosynthesis and forming the largest biomass reservoir. Unlike aquatic systems, terrestrial biomass pyramids are usually upright because long-lived plants accumulate substantial organic matter, supporting smaller, less biomass-dense consumer populations above.
Biomass Pyramid Structure in Aquatic Ecosystems
Biomass pyramids in aquatic ecosystems often display an inverted structure where lower trophic levels, such as phytoplankton, have less biomass than higher trophic levels like zooplankton or fish, due to rapid reproduction and turnover rates of producers. This contrasts with terrestrial ecosystems where producers typically have the greatest biomass. Understanding this unique biomass distribution is crucial for studying energy flow and nutrient cycling in aquatic food webs.
Key Differences Between Biomass Pyramids
Biomass pyramids represent the total mass of living organisms at each trophic level, while energy pyramids depict the flow of energy through each level in an ecosystem. Biomass pyramids can be upright or inverted, depending on factors like rapid reproduction at lower levels, whereas energy pyramids are always upright due to energy loss via heat at each transfer. The key difference lies in biomass measuring living material quantity and energy pyramids quantifying energy transfer efficiency across trophic levels.
Factors Influencing Biomass Pyramid Shapes
Biomass pyramid shapes are influenced by factors such as primary productivity, trophic efficiency, and organism lifespan. In aquatic ecosystems, inverted biomass pyramids occur due to rapid reproduction rates of phytoplankton supporting larger consumer biomass. Terrestrial biomass pyramids typically display a broad base of producers and decreasing biomass at higher trophic levels, driven by plant biomass accumulation and slower consumer turnover.
Ecological Significance of Biomass Pyramids
Biomass pyramids illustrate the total mass of living organisms at each trophic level and serve as a critical indicator of ecosystem health and energy flow efficiency. In aquatic ecosystems, inverted biomass pyramids often occur due to rapid reproduction rates of phytoplankton, highlighting dynamic energy transfer compared to terrestrial ecosystems where biomass pyramids typically have larger producers. Understanding these variations in biomass distribution aids in assessing productivity, nutrient cycling, and the stability of food webs across different environments.
Biomass Pyramid Limitations and Misconceptions
Biomass pyramids often depict the total mass of living organisms at each trophic level but can be misleading due to seasonal fluctuations, varying turnover rates, and differing organism sizes, potentially distorting energy flow understanding. Inverted biomass pyramids, common in aquatic ecosystems, challenge traditional interpretations, as rapid reproduction rates in lower trophic levels despite low biomass can misrepresent ecosystem productivity. Limitations also arise from ignoring detritus and microbial loops, which play crucial roles in nutrient cycling and energy transfer, thus requiring careful consideration when analyzing trophic dynamics.
Conclusion: Comparing Biomass Pyramids across Ecosystems
Biomass pyramids vary significantly across ecosystems, reflecting energy flow and trophic structure differences. Terrestrial ecosystems typically display upright biomass pyramids with large producer biomass supporting smaller herbivore and carnivore masses, whereas aquatic ecosystems often exhibit inverted pyramids due to rapid phytoplankton turnover. Understanding these variations is crucial for ecosystem management and assessing ecological productivity and energy transfer efficiency.
biomass pyramid Infographic