A flow duration curve (FDC) represents the percentage of time specific flow rates in a river or stream are equaled or exceeded, providing crucial insights into water availability and variability. FDCs are essential tools in hydrology for water resource management, ecological assessment, and engineering design by illustrating the relationship between flow magnitude and frequency. Explore the rest of the article to understand how flow duration curves can inform and optimize your water management strategies.
Table of Comparison
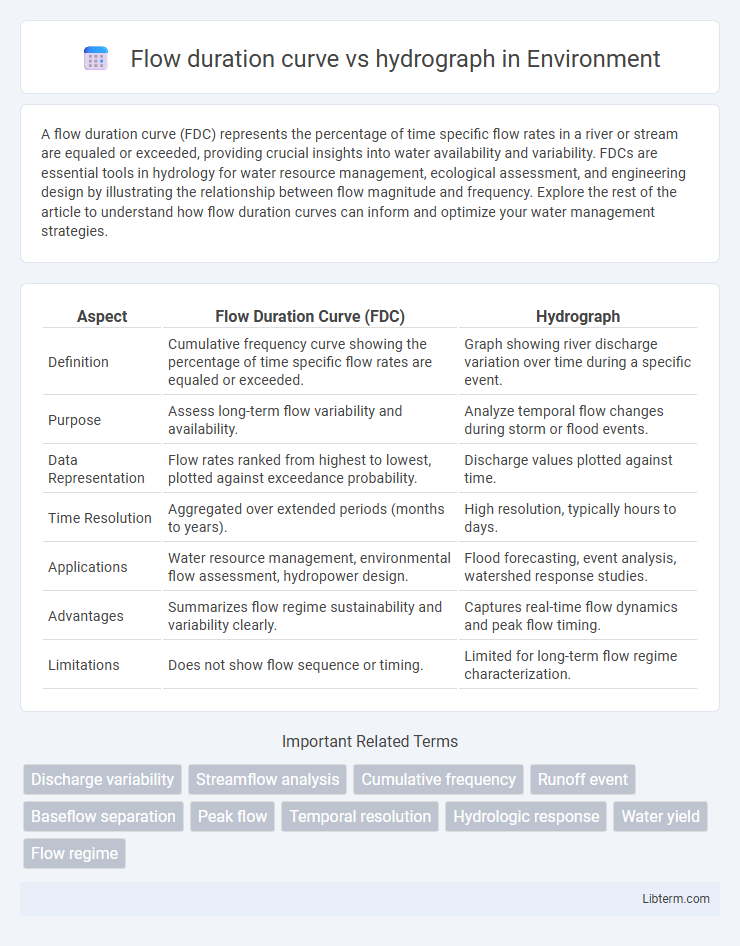
| Aspect | Flow Duration Curve (FDC) | Hydrograph |
|---|---|---|
| Definition | Cumulative frequency curve showing the percentage of time specific flow rates are equaled or exceeded. | Graph showing river discharge variation over time during a specific event. |
| Purpose | Assess long-term flow variability and availability. | Analyze temporal flow changes during storm or flood events. |
| Data Representation | Flow rates ranked from highest to lowest, plotted against exceedance probability. | Discharge values plotted against time. |
| Time Resolution | Aggregated over extended periods (months to years). | High resolution, typically hours to days. |
| Applications | Water resource management, environmental flow assessment, hydropower design. | Flood forecasting, event analysis, watershed response studies. |
| Advantages | Summarizes flow regime sustainability and variability clearly. | Captures real-time flow dynamics and peak flow timing. |
| Limitations | Does not show flow sequence or timing. | Limited for long-term flow regime characterization. |
Introduction to Flow Duration Curve and Hydrograph
A Flow Duration Curve (FDC) represents the percentage of time specific flow rates are equaled or exceeded in a river, providing a comprehensive view of flow variability over time. Unlike hydrographs that illustrate instantaneous streamflow changes during storm events, FDCs summarize long-term flow regimes and are crucial for water resource management, ecological studies, and hydropower design. Hydrographs plot discharge against time, capturing short-term flow dynamics, while FDCs emphasize the frequency distribution of flows, revealing flow reliability and availability.
Defining Flow Duration Curve (FDC)
The Flow Duration Curve (FDC) represents the percentage of time specific flow rates in a river or stream are equaled or exceeded, providing a statistical summary of flow variability. Unlike the hydrograph, which shows flow fluctuations over a short time span during individual events, the FDC condenses long-term flow data into a continuous curve highlighting flow reliability and variability. Hydrologists use FDCs to assess water resource availability, ecological health, and design criteria for hydraulic structures based on flow frequency and magnitude.
Defining Hydrograph
A hydrograph is a graphical representation of how river discharge or streamflow varies over time at a specific location, typically capturing the response of a watershed to a precipitation event. It depicts the temporal distribution of flow, showing rise, peak, and recession phases, essential for flood forecasting and water resource management. In contrast, a flow duration curve orders flow magnitudes from highest to lowest, illustrating the percentage of time specific flows are equaled or exceeded, without indicating timing or sequence.
Purpose and Applications of FDC
Flow duration curves (FDCs) provide a comprehensive statistical representation of streamflow variability over a specified period, illustrating the percentage of time flows exceed particular discharge values, which is crucial for long-term water resource management. Unlike hydrographs that depict flow variations over time for specific events, FDCs are extensively applied in hydropower planning, drought assessment, and ecological flow evaluation by identifying the frequency and reliability of different flow conditions. The FDC's ability to summarize flow regimes supports decision-making in reservoir operation, infrastructure design, and sustainable water allocation practices.
Purpose and Applications of Hydrograph
A hydrograph visually represents the variation of river discharge over time following a precipitation event, essential for flood forecasting and the design of hydraulic structures. It provides detailed temporal flow patterns that aid in watershed management, irrigation scheduling, and real-time flood warning systems. Hydrographs facilitate the analysis of runoff response, enabling engineers and hydrologists to predict peak flow rates and durations critical for infrastructure resilience.
Key Differences between FDC and Hydrograph
Flow duration curves (FDC) represent the percentage of time specific flow rates are equaled or exceeded, offering insights into flow variability over a long period, while hydrographs display flow rate changes over time following precipitation events, emphasizing short-term temporal variation. FDCs are used primarily for assessing water resource availability, planning, and management, whereas hydrographs are critical for flood forecasting, stormwater design, and understanding event-driven flow responses. Unlike hydrographs, FDCs abstract time dimension to focus on flow frequency distribution, making them essential for evaluating base flow and drought conditions.
Advantages of Using Flow Duration Curve
Flow duration curves provide a comprehensive representation of streamflow variability by displaying the percentage of time specific flow rates are equaled or exceeded, offering valuable insights for water resource management and ecological studies. Unlike hydrographs, which show temporal changes in flow, flow duration curves enable the assessment of flow reliability, drought risk, and sediment transport potential over long periods. Their statistical nature aids in designing hydraulic structures, optimizing reservoir operations, and supporting sustainable water allocation strategies.
Advantages of Using Hydrograph
Hydrographs provide detailed time-series data on river discharge, enabling precise analysis of flow variations during storm events and seasonal changes. This temporal resolution assists in flood forecasting, water resource management, and designing hydraulic structures with accurate peak flow timing and duration. Hydrographs enhance the understanding of flow dynamics compared to flow duration curves, which offer only cumulative flow frequency without temporal context.
Limitations of FDC and Hydrograph
Flow duration curves (FDCs) provide a statistical representation of flow variability but lack temporal resolution, making it difficult to capture event-specific hydrological responses. Hydrographs offer detailed time-sequenced flow data useful for flood analysis but may not represent long-term flow variability or predict flow exceedance probabilities effectively. Both tools have limitations in integrating spatial heterogeneity and complex watershed processes, which can affect water resource management decisions.
Selecting the Right Tool: FDC vs Hydrograph
Selecting the right tool between a Flow Duration Curve (FDC) and a hydrograph depends on the objective of water resource analysis; FDC provides a statistical representation of flow variability over time, ideal for assessing long-term water availability and reliability. Hydrographs offer detailed insights into flow changes during specific events, essential for flood management and real-time flow prediction. Prioritizing FDCs helps in sustainable water allocation planning, while hydrographs are critical for event-based operational decisions.
Flow duration curve Infographic