A hyetograph is a graphical representation of the distribution of rainfall intensity over time for a specific storm event, crucial for hydrologic studies and flood forecasting. It helps engineers and meteorologists analyze precipitation patterns and design stormwater management systems that protect your infrastructure from potential water damage. Explore the rest of this article to understand how hyetographs are created and applied in real-world scenarios.
Table of Comparison
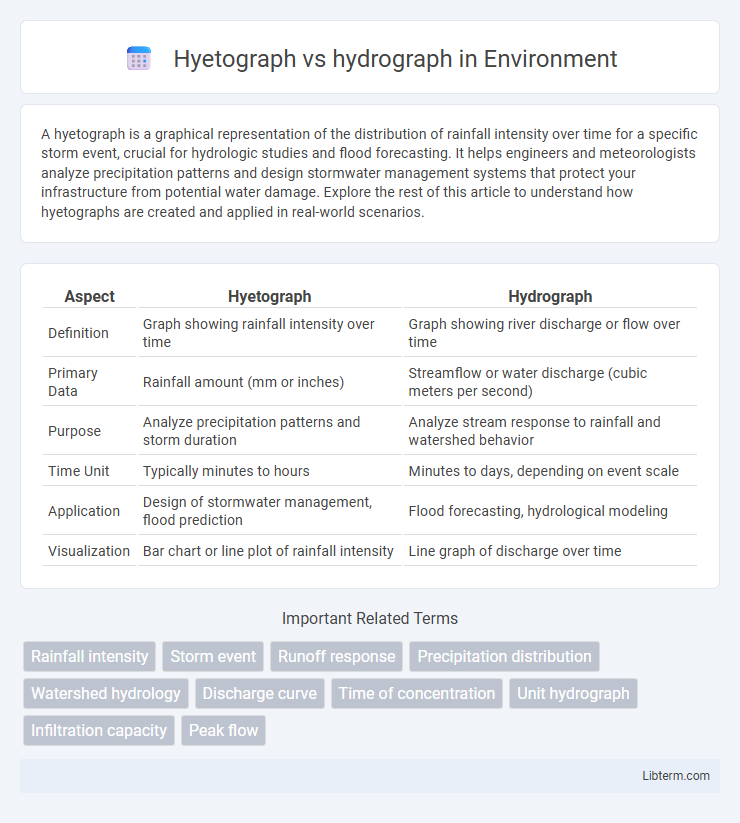
| Aspect | Hyetograph | Hydrograph |
|---|---|---|
| Definition | Graph showing rainfall intensity over time | Graph showing river discharge or flow over time |
| Primary Data | Rainfall amount (mm or inches) | Streamflow or water discharge (cubic meters per second) |
| Purpose | Analyze precipitation patterns and storm duration | Analyze stream response to rainfall and watershed behavior |
| Time Unit | Typically minutes to hours | Minutes to days, depending on event scale |
| Application | Design of stormwater management, flood prediction | Flood forecasting, hydrological modeling |
| Visualization | Bar chart or line plot of rainfall intensity | Line graph of discharge over time |
Definition of Hyetograph
A hyetograph is a graphical representation showing the distribution of rainfall intensity over time during a specific storm event, typically plotted as bars indicating precipitation amounts at fixed intervals. It is essential for hydrological analysis to understand rainfall patterns and their impact on runoff generation. In contrast, a hydrograph depicts the flow rate or discharge of water in a river or stream over time, reflecting the watershed's response to rainfall input.
Definition of Hydrograph
A hydrograph is a graphical representation of the flow rate or discharge of water versus time at a specific point in a river or stream, reflecting the response of a watershed to precipitation. It provides crucial data on runoff characteristics, peak discharge, lag time, and base flow, helping in flood forecasting and water resource management. Unlike a hyetograph, which displays rainfall intensity over time, a hydrograph focuses on the resulting streamflow behavior and volume after rainfall events.
Key Differences Between Hyetograph and Hydrograph
A hyetograph represents the intensity and distribution of rainfall over time, showing precipitation depth versus time intervals, while a hydrograph depicts the variation of river discharge or flow rate over time following rainfall events. Key differences include the hyetograph focusing on rainfall input, measured in millimeters or inches per unit time, whereas the hydrograph illustrates the runoff response, expressed in cubic meters per second or cubic feet per second. Understanding these distinctions is crucial for hydrologists in flood forecasting, watershed management, and designing effective drainage systems.
Importance in Hydrology Studies
Hyetographs and hydrographs play crucial roles in hydrology by providing complementary data on precipitation and streamflow patterns, essential for flood forecasting and water resource management. Hyetographs display rainfall intensity over time, enabling precise analysis of storm events and their impact on watershed response. Hydrographs represent river discharge variability, facilitating the understanding of runoff processes, watershed characteristics, and the assessment of hydrological models.
Components of a Hyetograph
A hyetograph visually represents the temporal distribution of rainfall intensity during a storm event, consisting of discrete rainfall intensity bars plotted against time intervals. Key components include rainfall intensities, total rainfall depth, and time increments, enabling detailed analysis of precipitation patterns. This data assists in hydrological modeling by facilitating predictions of runoff and flood events, distinguishing it from the hydrograph, which plots streamflow response over time.
Components of a Hydrograph
A hydrograph consists of key components including the rising limb, peak discharge, recessional limb, and base flow, each representing distinct phases of river discharge over time following a rainfall event. The rising limb reflects increasing streamflow due to surface runoff, whereas the peak discharge indicates the maximum flow resulting from peak rainfall intensity shown in the hyetograph. The recessional limb illustrates the gradual decrease in discharge as runoff diminishes, while base flow represents the sustained groundwater contribution to the river.
Application Areas of Hyetographs
Hyetographs are essential in urban stormwater management, helping engineers design effective drainage systems by illustrating rainfall intensity over time. They enable precise flood forecasting and flood risk assessment by providing detailed precipitation patterns. In hydrological modeling, hyetographs improve water resource planning by simulating watershed responses to varying rainfall events.
Application Areas of Hydrographs
Hydrographs are crucial in hydrology and water resource management, used to analyze river discharge over time following a rainfall event, aiding in flood forecasting, drainage design, and watershed management. Unlike hyetographs that represent rainfall intensity distribution, hydrographs provide insights into streamflow patterns essential for urban planning, reservoir operation, and irrigation scheduling. Their application areas extend to environmental impact assessments and the design of flood control infrastructure, ensuring effective water management and risk mitigation.
Data Collection Methods
Hyetographs represent rainfall intensity data collected using rain gauges that record precipitation over specified time intervals, providing temporal distribution of rainfall. Hydrographs display streamflow or discharge data collected via flow meters, weirs, or stage-discharge relationships from gauging stations, illustrating water flow response to rainfall events. Accurate synchronization of hyetograph and hydrograph data is critical for analyzing watershed hydrologic processes and flood forecasting.
Comparative Analysis: Hyetograph vs Hydrograph
A hyetograph represents rainfall intensity distribution over time, mapping precipitation events with precise temporal resolution, while a hydrograph illustrates streamflow or discharge response in a river or watershed over time. The hyetograph captures input data for hydrological models, critical for analyzing rainfall-runoff processes, whereas the hydrograph reflects the output, showing how a watershed responds to rainfall inputs through flow rates. Comparative analysis reveals that hyetographs focus on meteorological inputs, whereas hydrographs emphasize hydrological outputs, both essential for flood forecasting and water resource management.
Hyetograph Infographic