A hyetograph visually represents rainfall intensity over time, while a hydrograph charts streamflow or river discharge during and after precipitation events. Understanding the relationship between these two graphs is crucial for effective water resource management and flood prediction. Explore the full article to learn how analyzing hyetographs and hydrographs can enhance your hydrological insights.
Table of Comparison
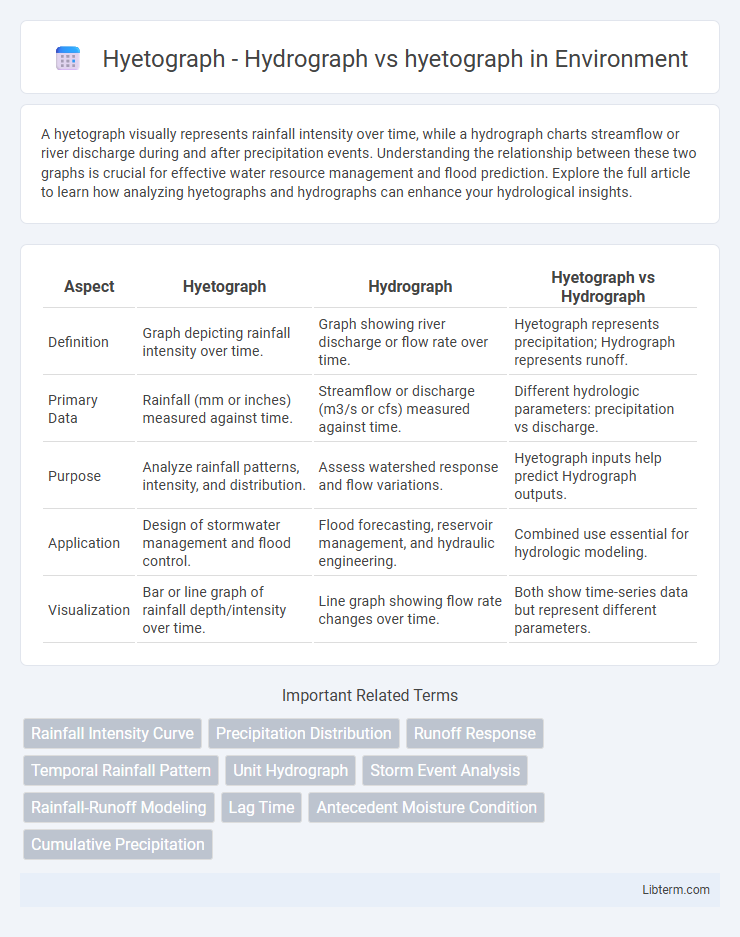
| Aspect | Hyetograph | Hydrograph | Hyetograph vs Hydrograph |
|---|---|---|---|
| Definition | Graph depicting rainfall intensity over time. | Graph showing river discharge or flow rate over time. | Hyetograph represents precipitation; Hydrograph represents runoff. |
| Primary Data | Rainfall (mm or inches) measured against time. | Streamflow or discharge (m3/s or cfs) measured against time. | Different hydrologic parameters: precipitation vs discharge. |
| Purpose | Analyze rainfall patterns, intensity, and distribution. | Assess watershed response and flow variations. | Hyetograph inputs help predict Hydrograph outputs. |
| Application | Design of stormwater management and flood control. | Flood forecasting, reservoir management, and hydraulic engineering. | Combined use essential for hydrologic modeling. |
| Visualization | Bar or line graph of rainfall depth/intensity over time. | Line graph showing flow rate changes over time. | Both show time-series data but represent different parameters. |
Introduction to Hydrological Graphs
Hyetographs and hydrographs are essential hydrological graphs used to analyze rainfall and runoff processes. A hyetograph represents the variation of rainfall intensity over time, usually displayed as a bar graph, while a hydrograph depicts the flow rate of a river or stream downstream in response to rainfall, shown as a line graph. These graphs facilitate understanding the temporal distribution of precipitation and its impact on streamflow, crucial for flood forecasting and watershed management.
What is a Hyetograph?
A hyetograph is a graphical representation that depicts the distribution of rainfall intensity over a specific period of time. Unlike a hydrograph, which illustrates the flow rate or discharge of water in a river or stream, a hyetograph focuses solely on precipitation data collected from rain gauges. Hyetographs are essential tools in hydrology for analyzing storm events, modeling watershed response, and designing effective drainage systems.
What is a Hydrograph?
A hydrograph is a graphical representation of river discharge or streamflow over time, typically used in hydrology to analyze the response of a watershed to precipitation events. It plots the flow rate (usually in cubic meters per second) on the y-axis against time on the x-axis, revealing patterns such as peak flow, base flow, and lag time. Contrastingly, a hyetograph specifically charts rainfall intensity over time, providing critical data inputs for generating hydrographs and understanding runoff dynamics.
Key Differences Between Hyetograph and Hydrograph
A hyetograph represents the distribution of rainfall intensity over time during a storm event, showing how precipitation varies within specific intervals. In contrast, a hydrograph illustrates the variation in river discharge or streamflow over time, reflecting how water flow responds to precipitation input and watershed characteristics. The key difference lies in hyetographs measuring rainfall input while hydrographs measure the resulting surface water response, essential for hydrologic analysis and flood forecasting.
Importance of Hyetographs in Hydrology
Hyetographs visually represent rainfall intensity over time, providing crucial data for hydrological analysis and flood forecasting. Unlike hydrographs, which illustrate streamflow response, hyetographs offer detailed insights into precipitation patterns that drive runoff generation. Accurate hyetograph data enhances watershed modeling, stormwater management, and infrastructure design by capturing temporal rainfall distribution essential for effective water resource planning.
The Role of Hydrographs in Water Resource Management
Hydrographs play a crucial role in water resource management by illustrating the temporal distribution of streamflow in response to precipitation events, enabling accurate flood forecasting and watershed analysis. Unlike hyetographs which represent rainfall intensity over time, hydrographs integrate both rainfall infiltration and runoff processes to reflect the dynamic behavior of a river system. Water resource managers rely on hydrographs for reservoir operation, flood control, and sustainable allocation of water during varying hydrological conditions.
Interpretation of Hyetograph vs Hydrograph Data
Hyetographs represent rainfall intensity over time, illustrating temporal precipitation patterns critical for understanding storm dynamics. Hydrographs depict streamflow or river discharge variations following rainfall events, reflecting watershed response and runoff characteristics. Interpreting hyetographs alongside hydrographs allows hydrologists to analyze the cause-effect relationship between rainfall input and river flow output, essential for flood forecasting and watershed management.
Practical Applications of Hyetographs and Hydrographs
Hyetographs and hydrographs are crucial tools in hydrology for analyzing rainfall and runoff patterns, respectively, to inform flood management and urban drainage design. Hyetographs depict the intensity and distribution of rainfall over time, enabling accurate prediction of stormwater response, while hydrographs show how river discharge varies in response to precipitation, essential for flood forecasting and water resource management. Engineers and hydrologists use these graphs in tandem to develop effective water control structures, optimize reservoir operations, and improve erosion control strategies.
Limitations of Hyetograph and Hydrograph Analysis
Hyetograph and hydrograph analysis each present limitations impacting hydrological assessments and flood forecasting accuracy. Hyetographs, which graph precipitation intensity over time, often fail to capture spatial variability and local storm dynamics, leading to potential misrepresentation of rainfall input. Hydrographs, depicting streamflow response over time, can be influenced by watershed characteristics and lag times, causing delayed or dampened flow representation that limits real-time flood prediction precision.
Conclusion: Selecting the Right Tool for Hydrological Studies
Hyetographs and hydrographs serve distinct roles in hydrological studies, with hyetographs illustrating rainfall intensity over time and hydrographs depicting river discharge responses. Selecting the right tool depends on specific study objectives, such as rainfall-runoff analysis favoring hyetographs and flood forecasting relying on hydrographs. Accurate interpretation of both graphs enhances water resource management, flood control strategies, and environmental planning.
Hyetograph - Hydrograph Infographic