Rainfall intensity-duration-frequency (IDF) curves are critical tools used in hydrology to design effective stormwater management systems by representing the relationship between rain intensity, duration, and the frequency of occurrence. A hyetograph visualizes the temporal distribution of rainfall intensity during a storm event, providing crucial data for accurate flood prediction and infrastructure resilience. Explore the rest of the article to understand how hyetographs and IDF curves can enhance your water resource planning and flood risk assessment.
Table of Comparison
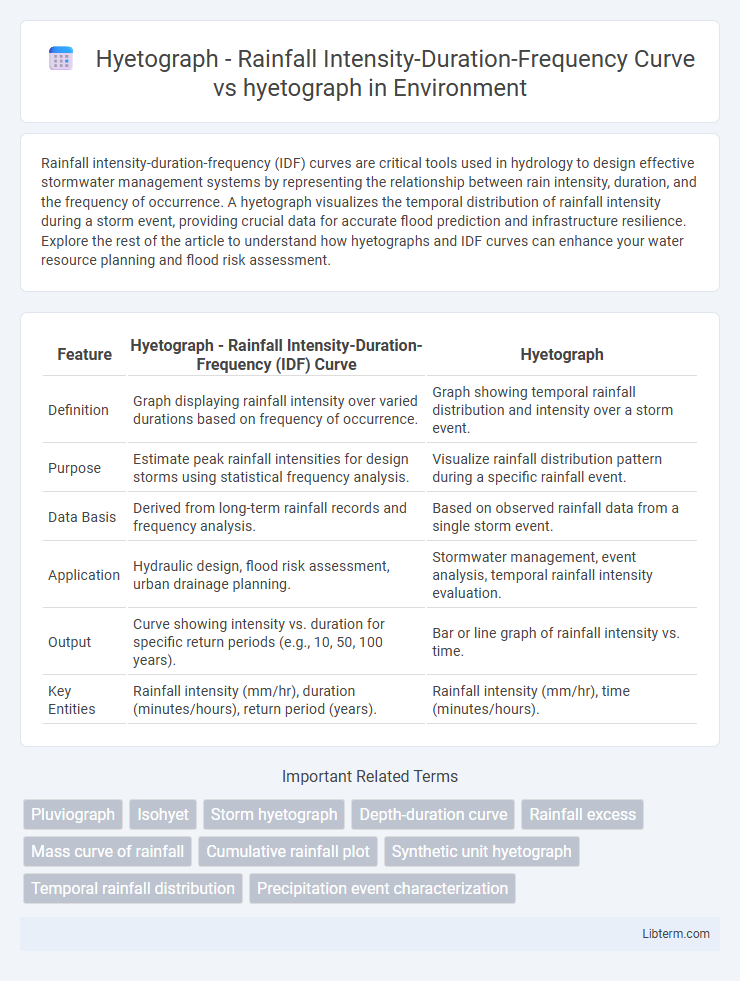
| Feature | Hyetograph - Rainfall Intensity-Duration-Frequency (IDF) Curve | Hyetograph |
|---|---|---|
| Definition | Graph displaying rainfall intensity over varied durations based on frequency of occurrence. | Graph showing temporal rainfall distribution and intensity over a storm event. |
| Purpose | Estimate peak rainfall intensities for design storms using statistical frequency analysis. | Visualize rainfall distribution pattern during a specific rainfall event. |
| Data Basis | Derived from long-term rainfall records and frequency analysis. | Based on observed rainfall data from a single storm event. |
| Application | Hydraulic design, flood risk assessment, urban drainage planning. | Stormwater management, event analysis, temporal rainfall intensity evaluation. |
| Output | Curve showing intensity vs. duration for specific return periods (e.g., 10, 50, 100 years). | Bar or line graph of rainfall intensity vs. time. |
| Key Entities | Rainfall intensity (mm/hr), duration (minutes/hours), return period (years). | Rainfall intensity (mm/hr), time (minutes/hours). |
Introduction to Hyetographs
Hyetographs graphically represent the distribution of rainfall intensity over time during a specific storm event, crucial for hydrological analysis and urban drainage design. The Rainfall Intensity-Duration-Frequency (IDF) curve provides statistical relationships between rainfall intensity, duration, and return period, aiding in predicting extreme rainfall events. While hyetographs depict actual temporal rainfall patterns, IDF curves serve as tools for estimating design storm intensities, allowing engineers to simulate realistic or synthetic storm scenarios for infrastructure planning.
Understanding Rainfall Intensity-Duration-Frequency (IDF) Curves
Rainfall Intensity-Duration-Frequency (IDF) curves graphically represent the relationship between rainfall intensity, duration, and the frequency of occurrence, aiding in the design of stormwater management systems. Unlike a hyetograph, which displays the temporal distribution of rainfall during a single storm event, IDF curves provide statistical estimates for various intensities over specified durations and return periods. Understanding IDF curves is essential for infrastructure planning, flood prediction, and hydraulic modeling in urban drainage and flood control projects.
Key Differences: Hyetograph vs IDF Curve
A hyetograph graphically represents the variation of rainfall intensity over time during a specific storm event, showing how rainfall intensity changes at short intervals. The Rainfall Intensity-Duration-Frequency (IDF) curve, in contrast, summarizes statistical rainfall intensity data for different durations and return periods, aiding in design and risk assessment. Key differences lie in their applications: hyetographs depict actual storm patterns while IDF curves provide probabilistic estimates for engineering and hydrological modeling.
Importance of Hyetographs in Hydrological Analysis
Hyetographs graphically represent rainfall intensity over time, crucial for understanding storm patterns and peak rainfall events, while Intensity-Duration-Frequency (IDF) curves provide statistical rainfall intensity data for various durations and return periods. Hyetographs enable hydrologists to analyze temporal distribution and intensity fluctuations during storm events, essential for designing stormwater management systems and predicting runoff. Accurate interpretation of hyetographs improves flood forecasting, watershed management, and sustainable urban drainage planning.
Applications of IDF Curves in Civil Engineering
IDF (Intensity-Duration-Frequency) curves are critical in civil engineering for designing stormwater infrastructure, such as drainage systems, culverts, and retention basins, ensuring they can handle specific rainfall intensities over various durations and return periods. Unlike hyetographs, which graphically represent temporal rainfall distribution, IDF curves provide a statistical basis for estimating peak rainfall intensity for given storm durations and frequencies. Utilizing IDF curves optimizes flood risk management and infrastructure resilience by aligning hydraulic design parameters with region-specific rainfall variability data.
Data Requirements for Hyetographs and IDF Curves
Hyetographs require high-resolution temporal rainfall data to capture the variation of rainfall intensity over short durations, typically recorded at intervals ranging from 5 to 60 minutes. In contrast, Intensity-Duration-Frequency (IDF) curves depend on statistical analysis of long-term rainfall records to estimate the probability of rainfall intensities for specific durations and return periods. Accurate hyetographs rely on fine-scale, event-based data while IDF curves demand extensive, continuous rainfall datasets spanning multiple years to ensure reliable frequency analysis.
Interpreting Rainfall Events with Hyetograph Analysis
Hyetographs graphically represent rainfall intensity over time, providing a continuous record of precipitation during an event, crucial for analyzing rainfall patterns and peak intensities. The Rainfall Intensity-Duration-Frequency (IDF) curve, in contrast, summarizes statistical rainfall data to estimate the probability of specific rainfall intensities over various durations for design and planning. Interpreting rainfall events with hyetograph analysis involves identifying intensity peaks, duration phases, and distribution patterns, enabling engineers to assess storm characteristics and inform drainage system design and flood risk management.
Comparing Rainfall Patterns: Event-Based vs Statistical Methods
Hyetographs represent event-based rainfall patterns showing intensity variation over time, providing a detailed temporal distribution for individual storms. Rainfall Intensity-Duration-Frequency (IDF) curves, derived from long-term precipitation records, statistically summarize rainfall intensity for varying durations and return periods, facilitating infrastructure design and risk assessment. Comparing these, hyetographs capture actual storm dynamics, while IDF curves offer generalized, probabilistic rainfall characteristics essential for planning under uncertain future conditions.
Limitations and Assumptions of Hyetographs and IDF Curves
Hyetographs represent the temporal distribution of rainfall intensity over time, assuming uniform rainfall across the catchment, which may not capture spatial variability accurately. Intensity-Duration-Frequency (IDF) curves are developed from statistical analyses of historical rainfall data and assume stationarity and homogeneity, limiting their applicability under changing climate conditions. Both tools face limitations in predicting extreme events due to simplified assumptions about rainfall patterns and require cautious interpretation when applied to complex hydrological modeling.
Practical Applications: Stormwater Management and Flood Prediction
Hyetographs graphically represent rainfall intensity over time, crucial for designing effective stormwater management systems by illustrating temporal rainfall distribution. Rainfall Intensity-Duration-Frequency (IDF) curves provide statistically derived rainfall intensities for specific durations and return periods, essential for infrastructure design standards. Utilizing both tools enhances flood prediction accuracy and optimizing urban drainage systems to mitigate flood risks.
Hyetograph - Rainfall Intensity-Duration-Frequency Curve Infographic