Isoline maps use lines to connect points of equal value, such as elevation, temperature, or pressure, providing a clear visual representation of spatial patterns. These maps help you quickly interpret geographic data by highlighting gradients and trends across regions. Explore the rest of the article to learn how isoline maps are created and applied in various fields.
Table of Comparison
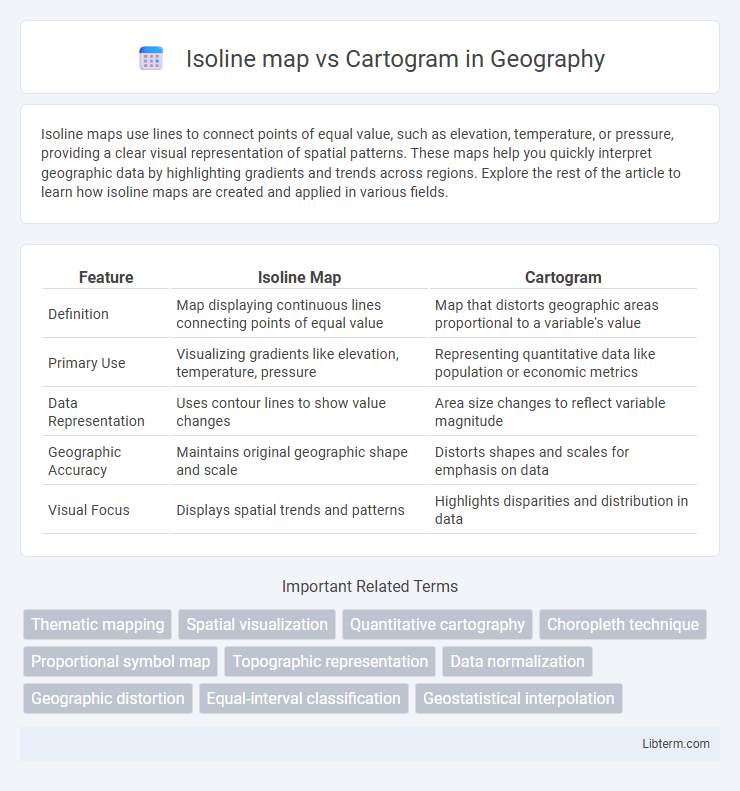
| Feature | Isoline Map | Cartogram |
|---|---|---|
| Definition | Map displaying continuous lines connecting points of equal value | Map that distorts geographic areas proportional to a variable's value |
| Primary Use | Visualizing gradients like elevation, temperature, pressure | Representing quantitative data like population or economic metrics |
| Data Representation | Uses contour lines to show value changes | Area size changes to reflect variable magnitude |
| Geographic Accuracy | Maintains original geographic shape and scale | Distorts shapes and scales for emphasis on data |
| Visual Focus | Displays spatial trends and patterns | Highlights disparities and distribution in data |
Introduction to Isoline Maps and Cartograms
Isoline maps represent continuous data by connecting points of equal value, such as temperature or elevation, creating contour lines that visualize gradients and patterns across geographic areas. Cartograms distort geographic regions proportionally to a specific variable, like population or economic output, allowing for immediate visual comparisons of data magnitude rather than geographic accuracy. Both isoline maps and cartograms serve distinct purposes in thematic mapping, enhancing spatial analysis by emphasizing data distribution and proportional relationships.
Definition and Core Principles of Isoline Maps
Isoline maps represent continuous data by connecting points of equal value through lines, such as elevation or temperature, enabling intuitive visualization of gradients across geographic areas. Core principles focus on accurately depicting variations by ensuring lines never cross and values increment logically, enhancing spatial interpretation of phenomena like topography or atmospheric pressure. Unlike cartograms, which distort space to reflect data magnitude, isoline maps maintain spatial accuracy while emphasizing quantitative continuity.
Definition and Core Principles of Cartograms
Cartograms are maps that distort geographic areas to represent data values, allowing the viewer to compare quantitative information spatially. Unlike isoline maps, which use continuous lines to represent equal data values such as elevation or temperature, cartograms resize regions based on metrics like population or economic output. The core principle of cartograms is maintaining recognizable shapes or relative locations while adjusting area to visually encode statistical information.
Key Differences Between Isoline Maps and Cartograms
Isoline maps represent continuous data through contour lines connecting points of equal value, effectively displaying gradients such as elevation or temperature. Cartograms distort geographic areas to reflect a specific variable, such as population or electoral votes, prioritizing data representation over geographic accuracy. The key difference lies in isoline maps maintaining spatial relationships with precise data values, while cartograms sacrifice geographic scale to emphasize variable magnitude.
Applications of Isoline Maps in Real-World Scenarios
Isoline maps are extensively used in meteorology to represent weather variables such as temperature, pressure, and precipitation, enabling accurate forecasting and climate analysis. In geography and environmental science, isoline maps assist in illustrating elevation, soil pH, and pollutant concentration, facilitating land use planning and resource management. Unlike cartograms that distort geographic areas to represent data values, isoline maps preserve spatial accuracy while visualizing continuous data fields, making them essential in fields requiring precise spatial interpretations.
Uses of Cartograms in Data Visualization
Cartograms are widely used in data visualization to represent statistical information by varying the size of geographic areas according to a specific data attribute, such as population or economic indicators, enabling clearer comparisons across regions. Unlike isoline maps that depict continuous data like elevation or temperature through contour lines, cartograms distort geographic boundaries to emphasize thematic variables, making them effective for highlighting disparities or patterns in spatial data. This technique is particularly valuable in fields such as demography, political science, and public health for visualizing election results, disease outbreaks, or resource distribution.
Advantages and Limitations of Isoline Maps
Isoline maps visually represent continuous data such as elevation, temperature, or pressure, making them ideal for identifying gradients and patterns across geographic areas. Their advantage lies in conveying complex spatial information clearly through contour lines, but they can be limited by difficulties in interpreting densely packed lines or representing discrete data accurately. Isoline maps may also struggle with depicting abrupt changes or small-scale variations, which can reduce clarity for detailed analysis compared to other mapping techniques like cartograms.
Strengths and Weaknesses of Cartograms
Cartograms visually distort geographic areas to represent a thematic variable, making it easier to compare data like population or economic metrics across regions. They effectively highlight relative magnitude but can confuse spatial relationships and geographic accuracy due to shape distortion. Limited readability and potential misinterpretation are key weaknesses when cartograms prioritize data over geographic fidelity.
Choosing Between Isoline Maps and Cartograms: Factors to Consider
Choosing between isoline maps and cartograms depends on the purpose of spatial representation and the nature of the data involved. Isoline maps excel in visualizing continuous phenomena such as temperature, elevation, or atmospheric pressure through contour lines, making them ideal for geographic and meteorological analysis. Cartograms distort geographic areas based on statistical values like population or economic indicators, offering clearer insights into data distribution but sacrificing spatial accuracy, which is crucial when comparing demographic or socio-economic patterns visually.
Future Trends in Thematic Mapping: Isoline Maps vs Cartograms
Future trends in thematic mapping emphasize enhanced interactivity and real-time data integration for both isoline maps and cartograms. Isoline maps will leverage advanced algorithms to improve accuracy in representing continuous data such as temperature and elevation, while cartograms will increasingly utilize dynamic scaling techniques to visualize demographic and economic shifts. The convergence of augmented reality and AI-driven analytics is set to transform these mapping methods into more immersive and insightful tools for spatial data interpretation.
Isoline map Infographic