An isotherm represents a line on a map or graph connecting points of equal temperature, crucial for understanding temperature distribution in meteorology and thermodynamics. These lines help visualize thermal patterns, aiding in weather forecasting and climate study by illustrating how temperature varies spatially. Explore the rest of the article to discover how isotherms impact your daily weather predictions and environmental analysis.
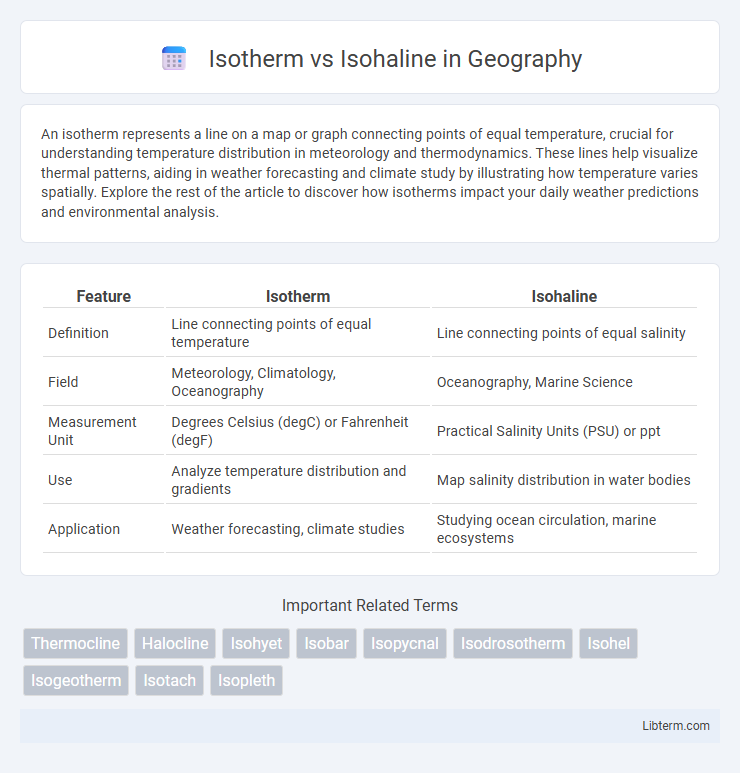
Table of Comparison
| Feature | Isotherm | Isohaline |
|---|---|---|
| Definition | Line connecting points of equal temperature | Line connecting points of equal salinity |
| Field | Meteorology, Climatology, Oceanography | Oceanography, Marine Science |
| Measurement Unit | Degrees Celsius (degC) or Fahrenheit (degF) | Practical Salinity Units (PSU) or ppt |
| Use | Analyze temperature distribution and gradients | Map salinity distribution in water bodies |
| Application | Weather forecasting, climate studies | Studying ocean circulation, marine ecosystems |
Understanding Isotherms: Definition and Importance
Isotherms represent lines on a map connecting points of equal temperature, crucial for analyzing climate patterns and weather forecasting. These contours help meteorologists visualize temperature distribution across regions, aiding in the prediction of heatwaves, cold fronts, and seasonal temperature shifts. Understanding isotherms enhances environmental and atmospheric studies by providing a clear representation of thermal gradients essential for ecological and agricultural planning.
What Are Isohalines? Meaning and Applications
Isohalines are lines on a map or chart connecting points of equal salinity in a body of water, crucial for studying marine and estuarine environments. They help researchers track saltwater intrusion, monitor changes in freshwater inflow, and analyze ecological impacts on aquatic habitats. Applications of isohalines include managing fisheries, assessing water quality, and modeling ocean circulation patterns.
Key Differences Between Isotherms and Isohalines
Isotherms represent lines on a map connecting points of equal temperature, essential for analyzing thermal distribution in meteorology and climatology. Isohalines, on the other hand, connect points of equal salinity, playing a critical role in oceanography for understanding salt concentration variations in seawater. The key difference lies in their parameter focus: isotherms map temperature, while isohalines map salinity, each aiding distinct environmental and scientific analyses.
Isotherms in Meteorology and Oceanography
Isotherms are lines on meteorological and oceanographic maps that connect points of equal temperature, crucial for analyzing weather patterns and ocean temperature distribution. These contours help identify thermal gradients, guide climate modeling, and influence the study of atmospheric convection and ocean currents. Unlike isohalines, which denote equal salinity, isotherms provide essential data for understanding heat transfer and energy flow in Earth's systems.
Isohalines: Role in Marine and Freshwater Studies
Isohalines represent lines of equal salinity on a map or chart, crucial for understanding the distribution of salt concentration in both marine and freshwater environments. They help researchers analyze water mass movements, mixing zones, and salinity gradients, which directly impact aquatic ecosystems and biogeochemical processes. In freshwater studies, isohalines assist in monitoring pollution dispersion and freshwater input effects, while in marine contexts, they are vital for tracking ocean currents and climate-related salinity changes.
How Are Isotherms and Isohalines Measured?
Isotherms are measured by mapping points of equal temperature using instruments like thermometers or infrared sensors across a geographical area, often represented as contour lines on weather maps. Isohalines are determined by sampling water salinity with devices such as CTD sensors (Conductivity, Temperature, Depth) or salinometers to identify zones of constant salinity, crucial in oceanography and estuarine studies. Both measurements involve spatial data interpolation to create continuous lines that help visualize temperature and salinity distributions respectively.
Visual Representation: Mapping Isotherms vs Isohalines
Isotherms are lines on a map connecting points of equal temperature, visually represented by smooth curves that highlight thermal gradients and temperature patterns across regions. Isohalines map salinity by linking locations of equal salt concentration in water bodies, often shown through contours reflecting spatial changes in salinity levels. Comparing these visualizations reveals how isotherms emphasize atmospheric or oceanic thermal distribution, while isohalines illustrate salinity variations critical for understanding marine environments and hydrological processes.
Practical Uses of Isotherms in Climate Science
Isotherms represent lines of equal temperature on maps, crucial for identifying temperature gradients and patterns in climate science, which helps forecast weather and understand climate zones. Isohalines, on the other hand, indicate lines of equal salinity, primarily used in oceanography to study seawater salinity distribution and its impact on marine ecosystems. The practical use of isotherms includes analyzing temperature trends critical for modeling climate change, assessing heatwaves, and monitoring global warming effects on different regions.
Isohalines and Their Significance in Salinity Distribution
Isohalines are contour lines on a map that connect points of equal salinity in a body of water, playing a crucial role in understanding salinity distribution in marine and estuarine environments. These lines help identify zones of freshwater mixing, saltwater intrusion, and variations in saline conditions essential for marine ecology and water quality management. Tracking isohalines assists oceanographers and environmental scientists in monitoring changes in salinity patterns due to seasonal shifts, freshwater inflows, or climate change impacts.
Comparative Analysis: When to Use Isotherms or Isohalines
Isotherms represent lines of equal temperature on a map, making them ideal for analyzing climate patterns, weather forecasting, and temperature distribution. Isohalines, on the other hand, connect points of equal salinity, providing critical data for oceanography, marine biology, and studying water mass mixing in estuaries. Choosing between isotherms and isohalines depends on the specific environmental parameter--temperature or salinity--requiring measurement and interpretation in meteorological versus hydrological contexts.
Isotherm Infographic