An isohyet is a line on a map connecting points of equal rainfall, helping meteorologists and hydrologists analyze precipitation patterns over a specific area. By understanding isohyets, you can better assess water availability for agriculture, flood management, and climate research. Explore the rest of the article to learn more about how isohyets impact environmental planning and weather forecasting.
Table of Comparison
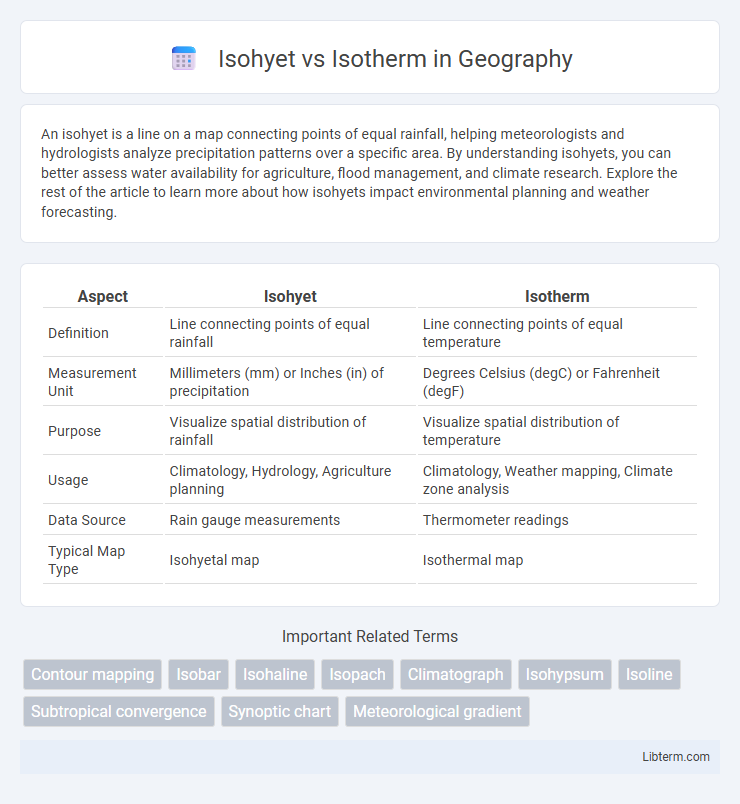
| Aspect | Isohyet | Isotherm |
|---|---|---|
| Definition | Line connecting points of equal rainfall | Line connecting points of equal temperature |
| Measurement Unit | Millimeters (mm) or Inches (in) of precipitation | Degrees Celsius (degC) or Fahrenheit (degF) |
| Purpose | Visualize spatial distribution of rainfall | Visualize spatial distribution of temperature |
| Usage | Climatology, Hydrology, Agriculture planning | Climatology, Weather mapping, Climate zone analysis |
| Data Source | Rain gauge measurements | Thermometer readings |
| Typical Map Type | Isohyetal map | Isothermal map |
Introduction to Isohyets and Isotherms
Isohyets are lines on a map that connect points of equal precipitation, providing valuable insight into rainfall distribution across a region. Isotherms are lines that connect points of equal temperature, helping to visualize temperature patterns and gradients. Both isohyets and isotherms are essential tools in meteorology and climatology for analyzing weather data and understanding climate variability.
Definitions: What Are Isohyets?
Isohyets are lines on a map that connect points of equal rainfall or precipitation, providing crucial data for meteorologists and hydrologists to analyze spatial distribution patterns. These contours help in understanding regional climate variations, water resource management, and predicting flood risks by visually representing rainfall intensity across different areas. In contrast, isotherms are lines that link points of equal temperature, serving distinct purposes in climatology and weather forecasting.
Definitions: What Are Isotherms?
Isotherms are contour lines on a map that connect points of equal temperature at a given time or averaged over a specific period. These lines help visualize temperature distribution and patterns across various geographic regions, aiding in climate and weather analysis. Unlike isohyets, which represent equal precipitation, isotherms specifically illustrate thermal variations, making them essential in meteorology and climatology studies.
Differences Between Isohyets and Isotherms
Isohyets represent lines on a map connecting points of equal precipitation, while isotherms join locations of equal temperature. Isohyets are primarily used in hydrology and meteorology to analyze rainfall distribution, whereas isotherms are essential for studying temperature patterns and climate variations. The key difference lies in the measured parameter: moisture for isohyets and thermal readings for isotherms.
Applications of Isohyet Maps in Meteorology
Isohyet maps, which depict lines of equal precipitation, are crucial in meteorology for identifying rainfall distribution patterns and managing water resources effectively. These maps assist meteorologists in flood forecasting, agricultural planning, and drought assessment by providing precise spatial precipitation data. In contrast, isotherm maps display equal temperature lines and are primarily used for analyzing temperature trends and climate zones rather than precipitation.
Uses of Isotherm Maps in Climate Studies
Isotherm maps are essential tools in climate studies for illustrating temperature distribution across different regions, aiding in the analysis of weather patterns and climate zones. They help meteorologists identify areas of equal temperature, facilitating the study of heatwaves, cold fronts, and seasonal variations. Isohyet maps, on the other hand, represent precipitation levels and are crucial for hydrological analyses and water resource management.
Methods for Drawing Isohyets and Isotherms
Isohyets are drawn by connecting points of equal precipitation on a weather map, typically using interpolated rainfall data from meteorological stations and employing methods like the polygon or Thiessen approach for accuracy. Isotherms are created by linking locations with identical temperature readings, relying on continuous temperature data and smoothing techniques such as spline or kriging interpolation to represent temperature gradients. Both methods require precise spatial data and interpolation to visualize climatic patterns effectively, aiding in meteorological and hydrological analyses.
Importance in Weather Forecasting
Isohyets, representing lines of equal precipitation, and isotherms, indicating lines of equal temperature, are crucial for accurate weather forecasting by mapping spatial variations in climate variables. Isohyets help meteorologists predict rainfall distribution and identify potential flooding zones, while isotherms assist in tracking temperature gradients essential for forecasting heatwaves, cold spells, and climate patterns. Integrating both isohyet and isotherm data enables comprehensive weather models that improve the precision of short-term and long-term forecasts.
Challenges in Interpreting Isohyets and Isotherms
Interpreting isohyets and isotherms presents challenges due to spatial variability and temporal fluctuations inherent in precipitation and temperature data. Isohyets, which map rainfall distribution, often face difficulties in accuracy because of uneven rain gauge placements and localized weather patterns. Isotherms, representing temperature gradients, can be affected by factors such as altitude variations, urban heat islands, and seasonal changes, complicating precise climatic analysis.
Conclusion: Isohyet vs Isotherm – Key Takeaways
Isohyets represent lines of equal precipitation, critical for understanding rainfall distribution and hydrological patterns, while isotherms denote lines of equal temperature, essential for analyzing climate zones and thermal gradients. Both are fundamental in meteorology and geography, but serve distinct purposes: isohyets map moisture variability, and isotherms illustrate temperature trends. Accurate interpretation of these maps supports effective environmental planning, agriculture, and climate studies.
Isohyet Infographic