Mind maps enhance your ability to organize ideas visually, making complex information easier to understand and recall. This technique leverages hierarchical diagrams to connect concepts, boosting creativity and productivity. Explore the full article to unlock how mind maps can transform your learning and planning processes.
Table of Comparison
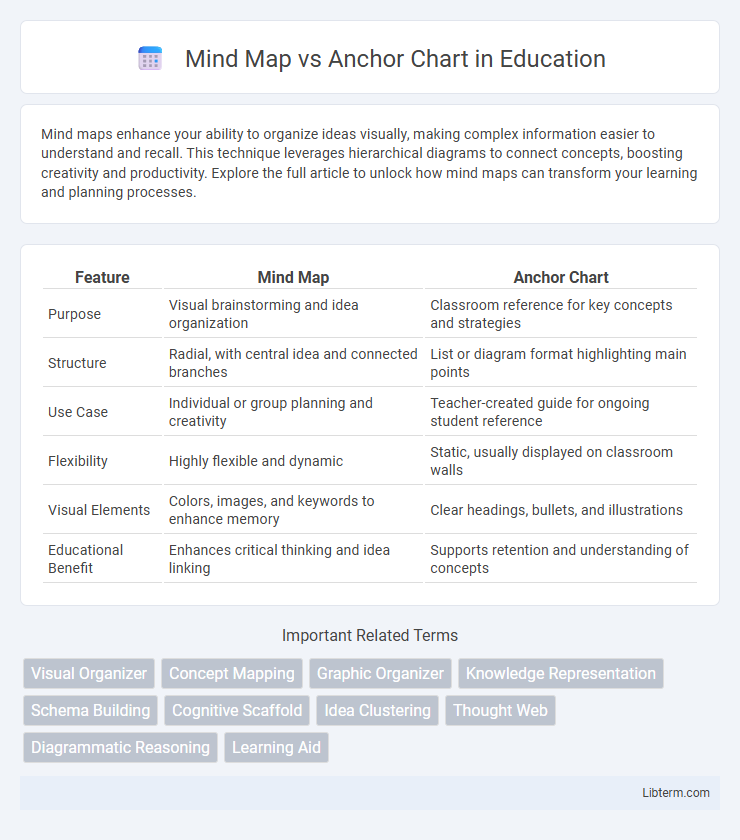
| Feature | Mind Map | Anchor Chart |
|---|---|---|
| Purpose | Visual brainstorming and idea organization | Classroom reference for key concepts and strategies |
| Structure | Radial, with central idea and connected branches | List or diagram format highlighting main points |
| Use Case | Individual or group planning and creativity | Teacher-created guide for ongoing student reference |
| Flexibility | Highly flexible and dynamic | Static, usually displayed on classroom walls |
| Visual Elements | Colors, images, and keywords to enhance memory | Clear headings, bullets, and illustrations |
| Educational Benefit | Enhances critical thinking and idea linking | Supports retention and understanding of concepts |
Introduction to Mind Maps and Anchor Charts
Mind maps are visual diagrams centered around a main concept, used to organize ideas and foster creative thinking through branching subtopics. Anchor charts serve as instructional tools displaying key information, strategies, or processes to support student learning and reference. Both tools enhance comprehension by visually structuring content, but mind maps emphasize idea generation while anchor charts focus on reinforcing specific lessons.
Key Differences Between Mind Maps and Anchor Charts
Mind maps visually organize information around a central concept using branches to represent ideas, promoting creative thinking and brainstorming. Anchor charts serve as instructional tools that display key concepts, strategies, or steps clearly to support learning and classroom management. Mind maps emphasize idea generation and connections, while anchor charts prioritize clarity and reference for teaching specific content.
What is a Mind Map?
A mind map is a visual tool that organizes information hierarchically around a central concept, using branches to represent related ideas and keywords. It enhances memory retention and brainstorming by allowing users to see connections and relationships between various topics at a glance. Mind maps are widely used in education, project planning, and creative problem-solving to facilitate clearer understanding and idea generation.
What is an Anchor Chart?
An anchor chart is a visual tool used in classrooms to support student learning by displaying key concepts, strategies, or processes. It serves as a reference point that helps students remember and apply information during lessons and independent work. Unlike mind maps, which organize ideas hierarchically and visually explore connections, anchor charts emphasize clear, concise explanations and step-by-step guidance on a specific topic.
Benefits of Using Mind Maps
Mind maps enhance creativity and memory retention by visually organizing complex ideas and showing relationships between concepts, making learning more interactive and engaging. They help improve problem-solving skills through hierarchical and associative connections, which anchor charts often lack due to their linear structure. Mind maps also facilitate personalized learning, allowing users to customize branches and colors to align with their cognitive preferences and boost information recall.
Advantages of Anchor Charts in Learning
Anchor charts enhance learning by providing clear, visual references that help students recall key concepts and processes; they support diverse learning styles through easily accessible, organized information. These charts foster classroom interaction, encouraging collaborative discussion and reinforcing content retention. Their adaptability allows for continuous updates, aligning with evolving lesson goals and strengthening students' comprehension over time.
When to Use Mind Maps vs Anchor Charts
Mind maps excel for brainstorming, organizing complex ideas, and visualizing relationships between concepts in a non-linear format, making them ideal for individual or group ideation sessions. Anchor charts work best when summarizing and displaying key information, rules, or processes in a clear, linear manner to support ongoing learning and reference in classrooms. Use mind maps to explore and connect ideas dynamically, while anchor charts are more effective for reinforcing established concepts and providing visual reminders.
Visual Features: Mind Maps vs Anchor Charts
Mind Maps use a radial structure with a central idea surrounded by branches and sub-branches, incorporating colors, images, and icons to enhance memory and creativity. Anchor Charts feature a linear or grid layout, emphasizing clear, concise information in bullet points or numbered lists with visuals like diagrams or charts to support understanding. The visual complexity of Mind Maps promotes idea generation, while Anchor Charts focus on straightforward information retention and classroom reference.
Best Practices for Creating Mind Maps and Anchor Charts
Effective mind maps use clear, concise keywords, vibrant colors, and hierarchical structures to enhance cognitive connections and memory retention. Anchor charts excel when they incorporate step-by-step instructions, visuals, and student-friendly language to support active learning and classroom engagement. Both tools benefit from collaboration, consistent updates, and strategic placement to maximize their educational impact.
Choosing the Right Tool for Your Learning Style
Mind maps enhance visual learners by organizing information hierarchically with branches and keywords, fostering creativity and memory retention. Anchor charts benefit kinesthetic and social learners through collaborative creation and display of key concepts, supporting step-by-step problem-solving and classroom interaction. Selecting between mind maps and anchor charts depends on whether you prefer individual visual structuring or group-based, interactive learning tools.
Mind Map Infographic