Graphic organizers enhance your ability to visually structure information, making complex data easier to understand and remember. They are valuable tools for brainstorming, organizing ideas, and improving study habits across various subjects. Discover how to effectively use graphic organizers to boost your learning and productivity in the rest of the article.
Table of Comparison
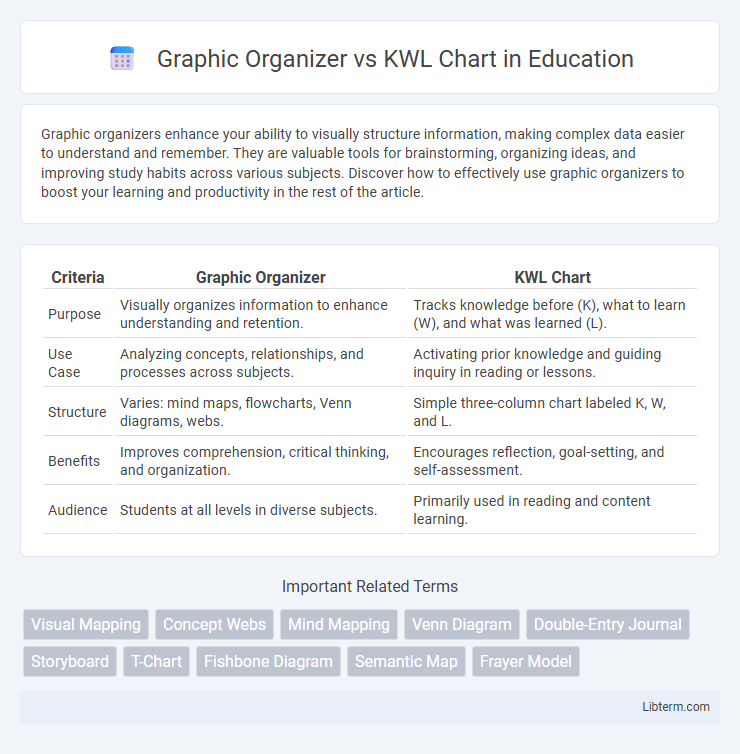
| Criteria | Graphic Organizer | KWL Chart |
|---|---|---|
| Purpose | Visually organizes information to enhance understanding and retention. | Tracks knowledge before (K), what to learn (W), and what was learned (L). |
| Use Case | Analyzing concepts, relationships, and processes across subjects. | Activating prior knowledge and guiding inquiry in reading or lessons. |
| Structure | Varies: mind maps, flowcharts, Venn diagrams, webs. | Simple three-column chart labeled K, W, and L. |
| Benefits | Improves comprehension, critical thinking, and organization. | Encourages reflection, goal-setting, and self-assessment. |
| Audience | Students at all levels in diverse subjects. | Primarily used in reading and content learning. |
Introduction to Graphic Organizers and KWL Charts
Graphic organizers are visual tools used to structure information, making complex concepts easier to understand by categorizing ideas and showing relationships. A KWL chart, a specific type of graphic organizer, helps learners track what they Know, Want to know, and have Learned about a topic, promoting active engagement and reflection. Both tools enhance comprehension and retention by organizing knowledge in a clear, accessible format.
What is a Graphic Organizer?
A graphic organizer is a visual tool used to structure information, enhance comprehension, and organize thoughts logically through diagrams like mind maps, flow charts, or webs. It supports critical thinking by breaking down complex topics into manageable parts, making it easier for students to analyze relationships, compare concepts, and summarize data effectively. Unlike the KWL chart, which focuses on what students Know, Want to know, and Learn, graphic organizers provide a broader range of formats for diverse learning objectives and subject areas.
What is a KWL Chart?
A KWL Chart is a graphic organizer that helps students track their learning by dividing information into three columns: "Know," "Want to Know," and "Learned." This tool encourages active engagement by prompting learners to activate prior knowledge, set learning goals, and reflect on new information acquired. Unlike general graphic organizers that vary widely in structure, the KWL Chart specifically supports metacognitive processes and improves comprehension in educational settings.
Key Features of Graphic Organizers
Graphic organizers visually structure information to enhance comprehension, featuring elements like charts, webs, and Venn diagrams that categorize and connect ideas. They support diverse learning styles by breaking down complex concepts into manageable parts, promoting critical thinking and organization. Unlike KWL charts that focus on what students Know, Want to know, and have Learned, graphic organizers offer broader applications for planning, analyzing, and synthesizing information.
Key Elements of KWL Charts
KWL charts consist of three key elements: "K" stands for what students Know about a topic, "W" lists what they Want to learn, and "L" captures what they have Learned after the lesson or research. This structure encourages active engagement, critical thinking, and reflection, making it an effective tool for brainstorming and tracking knowledge growth. Unlike broader graphic organizers, KWL charts specifically guide learners through a structured inquiry process.
Comparing Graphic Organizers and KWL Charts
Graphic organizers visually structure information to enhance comprehension and problem-solving, while KWL charts specifically guide learning by categorizing what learners Know, Want to know, and have Learned. Graphic organizers include diverse formats like concept maps, Venn diagrams, and flowcharts, offering flexibility across subjects. KWL charts focus on activating prior knowledge and tracking learning progress, making them particularly effective for reading comprehension and inquiry-based learning.
Benefits of Using Graphic Organizers
Graphic organizers enhance comprehension by visually structuring information, making complex concepts easier to understand and retain. They support critical thinking and organization by allowing learners to categorize and connect ideas clearly, improving overall cognitive processing. Compared to KWL charts, graphic organizers provide more flexible and detailed frameworks tailored for diverse subjects and learning styles.
Advantages of Implementing KWL Charts
KWL charts enhance active learning by organizing knowledge into what students Know, Want to know, and have Learned, improving information retention and comprehension. They encourage metacognitive skills by prompting learners to reflect on their prior knowledge and track their progress throughout lessons. KWL charts are versatile across subjects and grade levels, fostering student engagement and personalized learning experiences.
When to Use Graphic Organizers vs KWL Charts
Graphic organizers are ideal for structuring and visually representing complex information, making them effective during brainstorming, organizing ideas, and analyzing relationships in subjects like science and literature. KWL charts work best at the start and end of a learning unit to assess prior knowledge (What I Know), questions (What I Want to know), and new information gained (What I Learned), promoting active reading and reflection. Use graphic organizers when deep analysis and synthesis are required, and KWL charts when tracking learning progress and guiding inquiry.
Choosing the Right Tool for Effective Learning
Graphic organizers provide a broad range of visual tools, such as mind maps, flowcharts, and Venn diagrams, to help students organize and connect information across various subjects. KWL charts specifically guide learners through identifying what they Know, Want to know, and have Learned, making them ideal for structuring inquiry-based learning and reflection. Choosing the right tool depends on the learning objective: use graphic organizers for complex information processing and synthesis, while KWL charts excel in goal-setting and tracking knowledge acquisition.
Graphic Organizer Infographic