A mass curve graphically represents cumulative data to reveal trends in hydrology, sediment transport, or project progress over time. This tool helps you easily identify periods of significant accumulation or depletion, making it essential for managing water resources or tracking construction milestones. Explore the rest of the article to understand how to effectively interpret and apply mass curves in your projects.
Table of Comparison
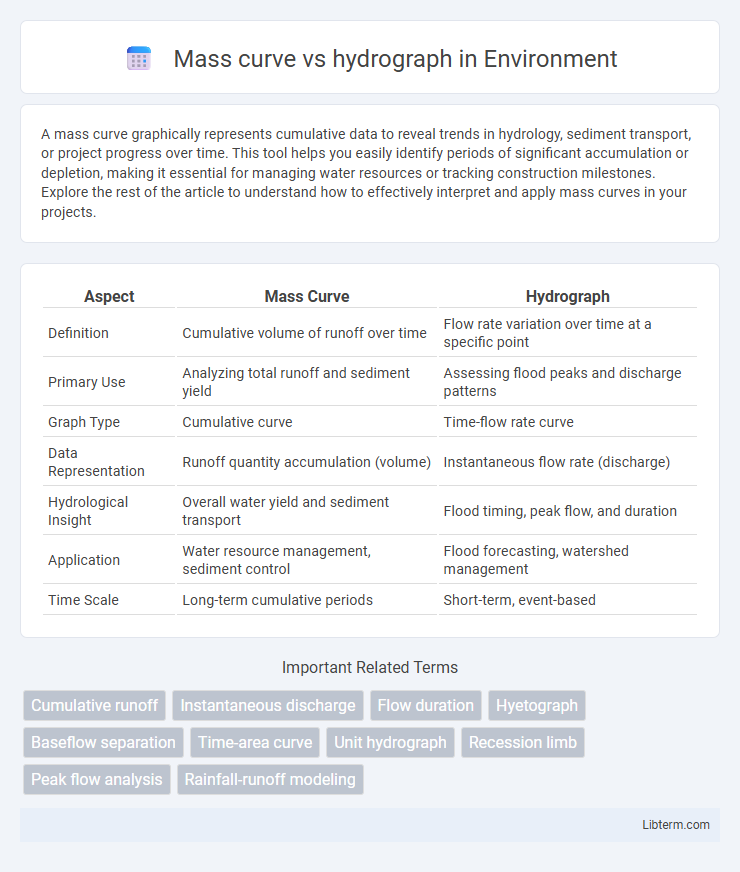
| Aspect | Mass Curve | Hydrograph |
|---|---|---|
| Definition | Cumulative volume of runoff over time | Flow rate variation over time at a specific point |
| Primary Use | Analyzing total runoff and sediment yield | Assessing flood peaks and discharge patterns |
| Graph Type | Cumulative curve | Time-flow rate curve |
| Data Representation | Runoff quantity accumulation (volume) | Instantaneous flow rate (discharge) |
| Hydrological Insight | Overall water yield and sediment transport | Flood timing, peak flow, and duration |
| Application | Water resource management, sediment control | Flood forecasting, watershed management |
| Time Scale | Long-term cumulative periods | Short-term, event-based |
Introduction to Mass Curve and Hydrograph
A mass curve represents the cumulative volume of water flow over time, effectively illustrating the total runoff in a watershed. Hydrographs depict the variation of discharge or flow rate at a specific point in a river or stream over time, highlighting the response of a catchment to precipitation events. Understanding these tools is essential for hydrological analysis, flood forecasting, and water resource management, as they provide insights into runoff timing and magnitude.
Definition and Purpose of Mass Curve
The mass curve represents the cumulative volume of runoff or rainfall over time, serving to track the total inflow to a watershed or reservoir. It is used to analyze water availability, storage requirements, and reservoir operation by illustrating the accumulation of water without temporal fluctuations. Unlike the hydrograph, which displays instantaneous flow rates, the mass curve emphasizes the aggregated volume, aiding in flood management and water resource planning.
Definition and Purpose of Hydrograph
A hydrograph is a graphical representation of river discharge or streamflow over time, typically showing how water flow changes in response to rainfall or snowmelt. It is used to analyze the temporal distribution of flow in a watershed, aiding in flood prediction, water resource management, and designing hydraulic structures. In contrast, a mass curve depicts cumulative volume of runoff over time, emphasizing total water yield rather than instantaneous flow rates.
Key Differences Between Mass Curve and Hydrograph
Mass curve represents the cumulative volume of runoff over time, illustrating total water yield from a catchment, whereas a hydrograph shows flow rate variations at a specific point in a river or stream, capturing intensity and timing of runoff events. Mass curves emphasize long-term water accumulation and are vital for reservoir capacity planning, while hydrographs focus on short-term flood forecasting and watershed response analysis. Key differences include mass curve's aggregation of volume data versus hydrograph's temporal flow rate fluctuations, making each suited to distinct hydrological applications.
Data Requirements for Mass Curve and Hydrograph
Mass curve analysis requires cumulative flow data over time, often derived from continuous streamflow measurements, to represent the total volume of water yield within a watershed. Hydrograph data demand high-resolution temporal records of discharge rates, capturing flow variations during storm events to analyze peak flow and runoff characteristics. Both data sets rely on accurate, evenly spaced time intervals, but the hydrograph necessitates finer granularity for precise event-based analysis.
Construction Methods for Mass Curve
Mass curve construction methods involve cumulative plotting of sediment or runoff volumes over time, providing a clear visualization of total flow or sediment yield against time intervals. Key techniques include manual tabulation of discharge or sediment loads, followed by graphing the accumulated values to assess trends and watershed response during events. Unlike hydrographs that depict instantaneous flow rates, mass curves emphasize cumulative volume, aiding sediment management and reservoir planning with precise, time-integrated data.
Construction Methods for Hydrograph
Hydrographs are constructed using methods such as the unit hydrograph technique, which transforms rainfall excess into direct runoff, enabling time-based flow analysis at a watershed outlet. Rainfall-runoff models integrate precipitation data and watershed characteristics to simulate flow patterns, while the kinematic wave method solves simplified flow equations to estimate hydrograph shape. These construction methods contrast with mass curves that accumulate volume over time, focusing instead on temporal variations in discharge for precise flood forecasting and water resource management.
Practical Applications of Mass Curve
Mass curves provide a cumulative representation of runoff volume over time, enabling efficient water resource management and reservoir capacity planning. They are crucial for analyzing sediment transport, soil erosion, and assessing flood control measures by comparing volume changes rather than instant flows shown in hydrographs. Engineers use mass curves to optimize dam operations, irrigation scheduling, and watershed management through comprehensive volume assessment.
Practical Applications of Hydrograph
Hydrographs provide critical data in water resource management by displaying river discharge variations over time, enabling engineers to predict flood peaks and design effective flood control structures. Mass curves quantify cumulative runoff, essential for reservoir capacity planning and sedimentation analysis. Utilizing hydrograph information enhances irrigation scheduling and helps optimize water distribution in drought-prone regions.
Comparative Analysis: When to Use Mass Curve vs Hydrograph
Mass curves effectively represent cumulative runoff volume over time, making them ideal for analyzing the total water yield from a watershed during a storm event. Hydrographs provide detailed temporal distribution of flow rates, essential for flood forecasting and understanding peak discharge timing. Use mass curves for assessing overall water resource availability, and hydrographs for real-time flow dynamics and flood management.
Mass curve Infographic