A rating curve is a crucial tool in hydrology that represents the relationship between water stage (height) and discharge (flow rate) in rivers or streams. Understanding how to interpret and utilize rating curves can improve the accuracy of flood forecasting and water resource management. Explore the rest of the article to learn how rating curves directly impact your water-related projects and decision-making.
Table of Comparison
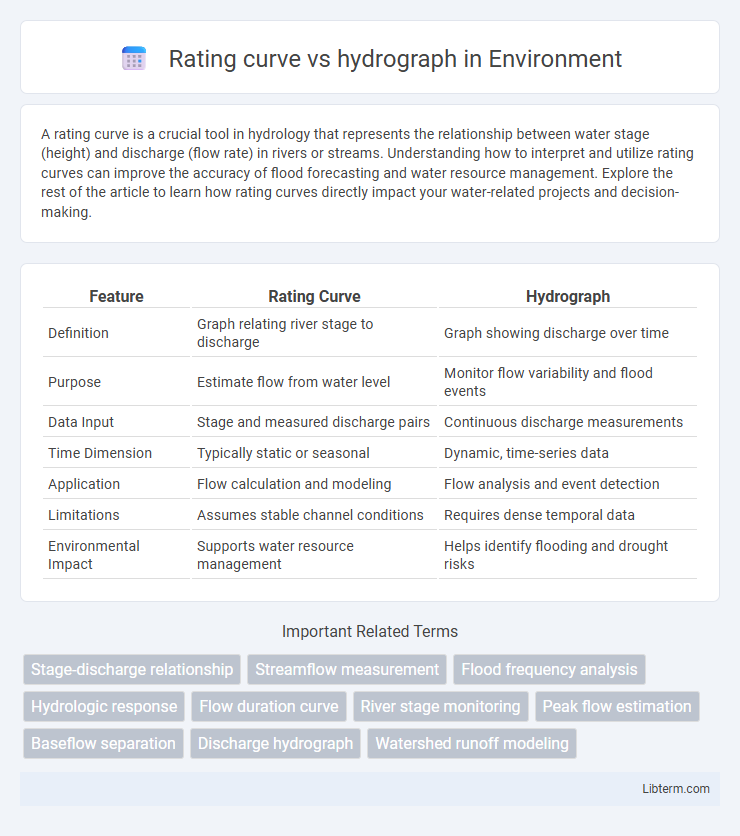
| Feature | Rating Curve | Hydrograph |
|---|---|---|
| Definition | Graph relating river stage to discharge | Graph showing discharge over time |
| Purpose | Estimate flow from water level | Monitor flow variability and flood events |
| Data Input | Stage and measured discharge pairs | Continuous discharge measurements |
| Time Dimension | Typically static or seasonal | Dynamic, time-series data |
| Application | Flow calculation and modeling | Flow analysis and event detection |
| Limitations | Assumes stable channel conditions | Requires dense temporal data |
| Environmental Impact | Supports water resource management | Helps identify flooding and drought risks |
Introduction to Rating Curve and Hydrograph
A rating curve illustrates the relationship between river stage (water level) and discharge, enabling the estimation of flow rates from stage measurements. A hydrograph represents the variation of discharge or stage over time, capturing the temporal dynamics of a river's response to precipitation events or seasonal changes. Understanding both concepts is essential for hydrologic modeling, flood forecasting, and water resource management.
Definitions: What is a Rating Curve?
A rating curve is a graphical relationship between river stage (water level) and discharge (flow rate), used to estimate streamflow from stage measurements. It is developed through direct flow measurements at different water levels to establish a reliable correlation. Hydrographs, in contrast, represent the variation of discharge or stage over time, providing temporal flow patterns rather than a stage-discharge relationship.
Definitions: What is a Hydrograph?
A hydrograph is a graphical representation of streamflow or river discharge over time at a specific location, capturing variations caused by rainfall, snowmelt, or other hydrological events. It displays the relationship between water flow rate (usually in cubic meters per second) and time, providing essential data for flood forecasting and water resource management. Unlike a rating curve, which relates stage height to discharge, a hydrograph emphasizes temporal changes in flow, illustrating peak flows and recession limbs during hydrologic events.
Key Differences Between Rating Curve and Hydrograph
A rating curve represents the mathematical relationship between river stage (water level) and discharge (flow rate), enabling flow estimation at a specific location based on water height measurements. In contrast, a hydrograph displays the variation of discharge over time at a particular cross-section, illustrating how flow responds to precipitation events or seasonal changes. While rating curves provide a static correlation for flow calculation, hydrographs deliver dynamic temporal flow patterns critical for flood forecasting and watershed management.
Applications of Rating Curve in Hydrology
Rating curves are essential in hydrology for converting stage measurements into accurate discharge estimates, enabling continuous flow monitoring in rivers and streams. They support flood forecasting, water resource management, and sediment transport studies by providing reliable stage-discharge relationships under varying flow conditions. Integration of rating curves with hydrographs enhances real-time analysis of flow dynamics, improving decision-making in flood risk assessment and environmental monitoring.
Applications of Hydrograph in Water Resource Management
Hydrographs play a crucial role in water resource management by providing detailed temporal data on streamflow, essential for flood forecasting, reservoir operation, and watershed management. Unlike rating curves, which relate water stage to discharge at specific points, hydrographs capture flow variations over time, enabling the analysis of peak flow events and baseflow characteristics. These insights support decision-making in flood risk mitigation, irrigation scheduling, and sustainable groundwater replenishment strategies.
Data Requirements for Rating Curve and Hydrograph
Rating curves require systematic stage-discharge measurements spanning various flow conditions to establish an accurate relation between water level and discharge. Hydrographs demand continuous, high-frequency recording of streamflow or stage data to capture temporal variations in flow rates during events. Both datasets must be precise and representative to support reliable hydrological modeling and water resource management.
Advantages and Limitations of Rating Curves
Rating curves provide a reliable method for estimating river discharge based on stage measurements, offering continuous flow data critical for water resource management and flood forecasting. Advantages include cost-effectiveness, ease of data collection, and applicability in unmonitored sites, but limitations arise from sensitivity to channel changes, sediment deposition, and extreme flow conditions, which can lead to inaccuracies. Unlike hydrographs that depict temporal flow variations, rating curves convert stage to discharge without directly representing temporal dynamics or event-specific flow peaks.
Advantages and Limitations of Hydrographs
Hydrographs provide a dynamic representation of river discharge over time, making them essential for analyzing flood events, storm runoff, and water resource management, with the advantage of tracking real-time flow variations. However, hydrographs require continuous data collection, and their accuracy can be compromised by equipment malfunctions or data gaps during extreme weather conditions. Unlike rating curves, hydrographs offer temporal flow patterns but can be limited in long-term discharge estimation without supplementary stage-discharge relationships.
Choosing the Right Tool: Rating Curve vs Hydrograph
Choosing between a rating curve and a hydrograph depends on the specific hydrological analysis needs; a rating curve is essential for converting stage measurements into discharge values, providing a reliable relationship for streamflow estimation. In contrast, a hydrograph offers a time-based representation of discharge, critical for understanding flow variations during storm events or seasonal changes. Selecting the right tool maximizes data accuracy and relevance, with rating curves ideal for discharge quantification and hydrographs suited for temporal flow dynamics analysis.
Rating curve Infographic