An isotherm represents a line on a graph or map connecting points of equal temperature, commonly used in meteorology and physical chemistry to illustrate temperature distribution or phase changes. In adsorption studies, isotherms describe how a gas or liquid interacts with a solid surface at constant temperature, providing insight into surface properties and material behavior. Explore the rest of this article to understand how isotherms can impact your analysis and applications.
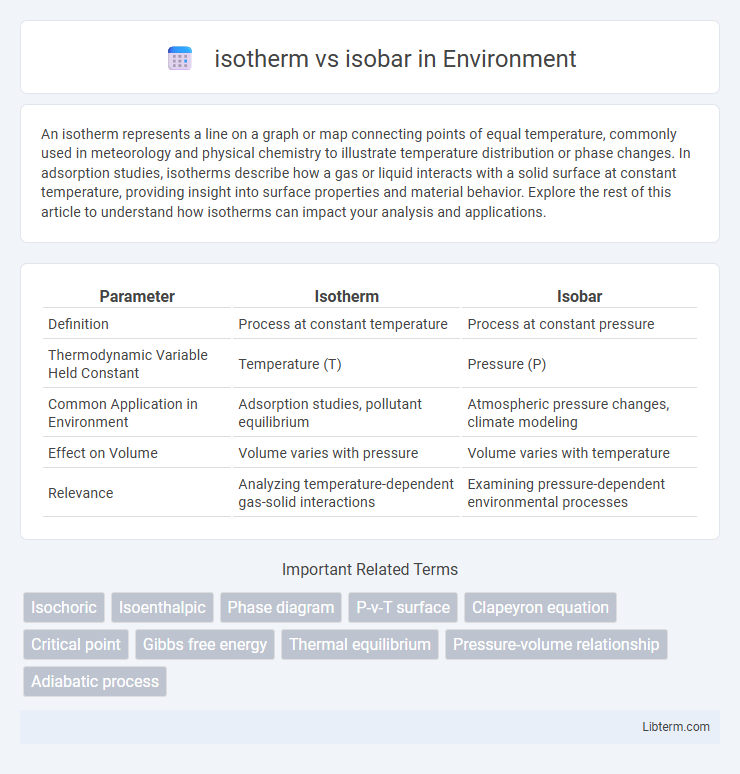
Table of Comparison
| Parameter | Isotherm | Isobar |
|---|---|---|
| Definition | Process at constant temperature | Process at constant pressure |
| Thermodynamic Variable Held Constant | Temperature (T) | Pressure (P) |
| Common Application in Environment | Adsorption studies, pollutant equilibrium | Atmospheric pressure changes, climate modeling |
| Effect on Volume | Volume varies with pressure | Volume varies with temperature |
| Relevance | Analyzing temperature-dependent gas-solid interactions | Examining pressure-dependent environmental processes |
Introduction to Isotherms and Isobars
Isotherms represent lines of constant temperature on a graph or map, illustrating how temperature remains stable despite changes in other variables such as pressure or volume. Isobars, on the other hand, depict lines of constant pressure, demonstrating regions where atmospheric or gas pressure remains uniform while temperature or volume may vary. Both concepts are fundamental in thermodynamics and meteorology for analyzing temperature-pressure relationships in various systems.
Definition of Isotherm
An isotherm is a curve on a graph representing points of equal temperature in a physical system, commonly used in thermodynamics and meteorology to analyze temperature distribution. In contrast, an isobar is a line connecting points of equal pressure, essential for understanding atmospheric pressure patterns. Isotherms help visualize temperature variations and heat flow, facilitating the study of phase changes and thermal properties of substances.
Definition of Isobar
An isobar is a line on a weather map connecting points of equal atmospheric pressure, typically measured in millibars (mb) or hectopascals (hPa). This meteorological tool aids in identifying high- and low-pressure systems, which influence wind patterns and weather conditions. Isotherms, by contrast, connect points of equal temperature, distinguishing temperature gradients rather than pressure variations.
Key Differences Between Isotherm and Isobar
Isotherms represent lines of constant temperature on a thermodynamic diagram, while isobars indicate lines of constant pressure. Isotherms are crucial for depicting processes where temperature remains unchanged, such as phase changes, whereas isobars illustrate processes occurring at steady pressure, commonly used in gas laws and engineering applications. The key difference lies in their defining variable: isotherms fix temperature, and isobars fix pressure, enabling distinct analysis of thermodynamic states and processes.
Applications of Isotherms
Isotherms are crucial in designing and optimizing chemical reactors where temperature control affects reaction rates, such as in adsorption processes for gas purification. They help model phase equilibrium and predict how substances interact at constant temperatures, essential for materials science and pharmaceuticals. Isotherm data guide the development of catalysts and the evaluation of thermodynamic properties in industries involving heat exchangers and desalination.
Applications of Isobars
Isobars, lines connecting points of equal pressure on a map, are crucial in weather forecasting and meteorology for identifying pressure systems such as cyclones and anticyclones that influence climate patterns. These applications enable accurate prediction of wind direction and speed, crucial for aviation and marine navigation safety. Isobars also assist in environmental monitoring by tracking atmospheric pressure changes associated with storms and severe weather events.
Importance in Thermodynamics
Isotherms and isobars are fundamental in thermodynamics for analyzing state changes under constant temperature and pressure, respectively. Isotherms help in studying phase transitions and gas laws by maintaining thermal equilibrium, while isobars are crucial for understanding processes like boiling and condensation under constant pressure conditions. These concepts enable precise control and prediction of thermodynamic properties in systems such as engines, refrigerators, and chemical reactors.
Visualization and Diagrammatic Representation
Isotherm and isobar diagrams visually represent thermodynamic states by fixing temperature and pressure, respectively. Isotherm curves on pressure-volume (P-V) diagrams display constant temperature processes, characterized by hyperbolic shapes following the ideal gas law. Isobar graphs plot volume versus temperature at constant pressure, typically illustrated as straight lines on volume-temperature (V-T) diagrams, emphasizing expansion or compression during heating or cooling.
Isotherm vs Isobar in Real-World Scenarios
Isotherms represent processes at constant temperature, typically applied in scenarios like phase changes in refrigeration systems where temperature stability is crucial. Isobars indicate constant pressure conditions, which are essential in weather forecasting models and industrial pressure vessel operations. Real-world applications leverage isotherms for temperature control in heat exchangers, while isobars are critical for understanding atmospheric pressure patterns and designing safety protocols in pressurized environments.
Summary and Final Comparison
Isotherms represent processes or curves at constant temperature, while isobars denote conditions at constant pressure, both fundamental in thermodynamics and phase diagrams. Isotherms illustrate how volume or pressure changes with temperature fixed, crucial in understanding ideal gas behavior, whereas isobars track volume or temperature variations under steady pressure, important for processes like boiling or melting. Comparing both, isotherms emphasize thermal equilibrium effects, and isobars highlight pressure-driven phase or state transitions, making each indispensable for analyzing different thermodynamic systems.
isotherm Infographic