Atmospheric methane levels have surged significantly over recent decades, driven largely by human activities such as fossil fuel extraction, agriculture, and waste management. These elevated methane concentrations contribute substantially to global warming due to methane's high heat-trapping efficiency compared to carbon dioxide. Explore the following article to understand the causes, impacts, and potential mitigation strategies for controlling methane trends in the atmosphere.
Table of Comparison
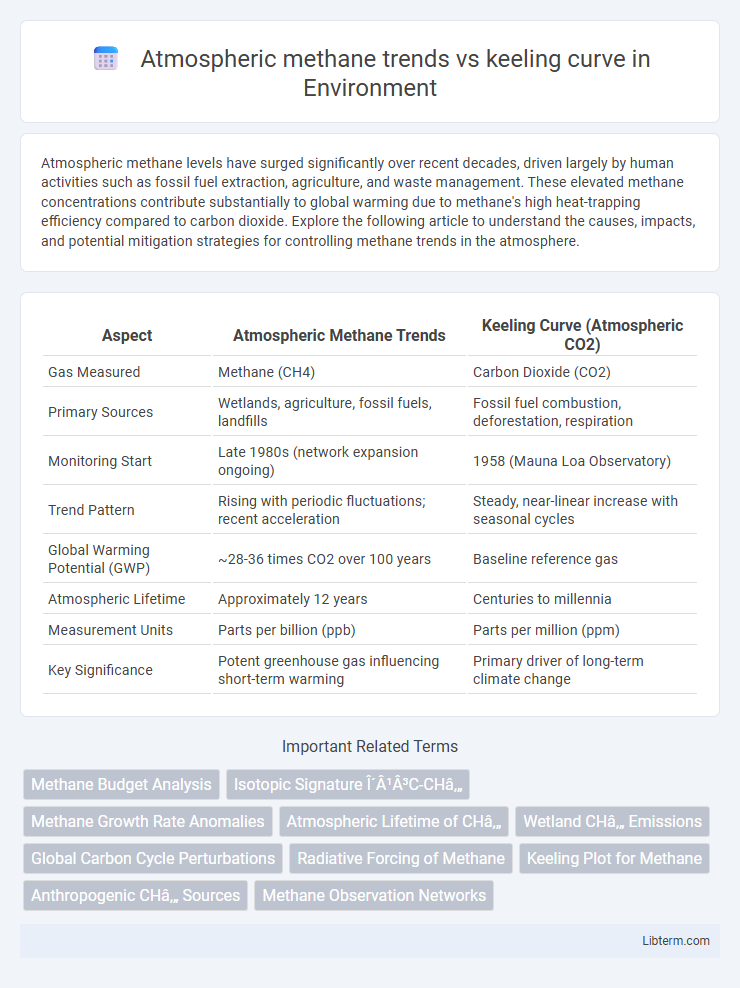
| Aspect | Atmospheric Methane Trends | Keeling Curve (Atmospheric CO2) |
|---|---|---|
| Gas Measured | Methane (CH4) | Carbon Dioxide (CO2) |
| Primary Sources | Wetlands, agriculture, fossil fuels, landfills | Fossil fuel combustion, deforestation, respiration |
| Monitoring Start | Late 1980s (network expansion ongoing) | 1958 (Mauna Loa Observatory) |
| Trend Pattern | Rising with periodic fluctuations; recent acceleration | Steady, near-linear increase with seasonal cycles |
| Global Warming Potential (GWP) | ~28-36 times CO2 over 100 years | Baseline reference gas |
| Atmospheric Lifetime | Approximately 12 years | Centuries to millennia |
| Measurement Units | Parts per billion (ppb) | Parts per million (ppm) |
| Key Significance | Potent greenhouse gas influencing short-term warming | Primary driver of long-term climate change |
Introduction to Atmospheric Methane and the Keeling Curve
Atmospheric methane (CH4) is a potent greenhouse gas with a global warming potential approximately 28-36 times greater than carbon dioxide over 100 years, playing a crucial role in climate change. The Keeling Curve, originally developed to track atmospheric carbon dioxide concentrations, serves as a foundational model for understanding long-term greenhouse gas trends, inspiring similar monitoring efforts for methane. Continuous measurements reveal that unlike the relatively steady rise in CO2 captured by the Keeling Curve, atmospheric methane concentrations exhibit more complex seasonal and interannual variability driven by diverse sources and sinks.
Understanding the Sources and Sinks of Methane
Atmospheric methane concentrations have exhibited a notable upward trend alongside the well-documented Keeling Curve, which tracks rising CO2 levels, highlighting the growing impact of greenhouse gases. Understanding methane sources, such as wetlands, agriculture, and fossil fuel extraction, is crucial for interpreting these trends and differentiating natural emissions from anthropogenic contributions. Methane sinks, including atmospheric oxidation by hydroxyl radicals, play a vital role in regulating methane lifetime and concentration, influencing the overall atmospheric methane budget and climate feedback mechanisms.
The Science Behind the Keeling Curve
The Keeling Curve represents the continuous record of atmospheric carbon dioxide concentrations measured at Mauna Loa Observatory, providing pivotal insight into global carbon cycles and climate change. Unlike methane, which exhibits more variable and geographically influenced trends due to its shorter atmospheric lifetime and diverse sources, the Keeling Curve's steady rise highlights the relentless increase of CO2 from fossil fuel combustion and land-use changes. Understanding the Keeling Curve's scientific basis aids in contextualizing atmospheric methane fluctuations within the broader framework of greenhouse gas-driven climate dynamics.
Historical Trends in Atmospheric Methane Concentrations
Historical trends in atmospheric methane concentrations reveal a significant increase from pre-industrial levels of about 700 parts per billion (ppb) to over 1900 ppb in recent years. This rise contrasts with the Keeling Curve, which tracks atmospheric CO2 at Mauna Loa Observatory, showing a steady increase from approximately 315 ppm in 1958 to over 420 ppm today. The distinct patterns of methane and CO2 highlight the differing sources and atmospheric lifetimes, with methane exhibiting more variability due to factors like wetlands, fossil fuel extraction, and agricultural emissions.
Comparing Methane and Carbon Dioxide Trends
Atmospheric methane concentrations have exhibited a more variable and rapid increase compared to the steady, well-documented rise in carbon dioxide levels depicted by the Keeling Curve. Methane's global warming potential is approximately 28-36 times greater than CO2 over a 100-year period, making its recent trend fluctuations critical for climate modeling. While CO2 shows a consistent seasonal cycle superimposed on an upward trajectory, methane trends reveal episodic spikes linked to natural and anthropogenic sources, highlighting the need for integrated greenhouse gas monitoring strategies.
Factors Influencing Changes in Methane Levels
Atmospheric methane levels exhibit variability influenced by natural sources such as wetlands and anthropogenic activities including agriculture, fossil fuel extraction, and landfills, contrasting with the primarily CO2-focused Keeling Curve that tracks carbon dioxide trends. Seasonal fluctuations, microbial oxidation in soils, and changes in atmospheric chemistry driven by hydroxyl radical concentrations also significantly impact methane concentrations. Satellite observations and ground-based measurements reveal that methane growth rates are increasingly tied to enhanced emissions from tropical wetlands and human-induced sources, complicating the feedback dynamics between methane and long-term climate change trends.
Recent Accelerations in Atmospheric Methane
Recent accelerations in atmospheric methane concentrations have shown a divergence from the steady increase depicted by the Keeling Curve for carbon dioxide, with methane levels rising at an unprecedented rate since the early 2000s. Key data from NOAA indicate methane growth rates have reached an annual increase of about 15 parts per billion, driven largely by enhanced emissions from wetlands, agriculture, and fossil fuel extraction. This accelerated methane trend poses significant challenges for greenhouse gas mitigation, as methane's global warming potential is over 80 times that of CO2 on a 20-year timescale.
Climate Impacts of Rising Methane vs. CO₂
Rising atmospheric methane levels have accelerated over recent decades, showing sharper increases compared to the steady rise in CO2 captured by the Keeling Curve. Methane's global warming potential is over 28 times greater than CO2 over a 100-year period, significantly amplifying short-term climate forcing. This potent greenhouse gas drives stronger warming impacts, contributing to faster ice melt, altered weather patterns, and enhanced feedback loops that exacerbate climate change beyond CO2 effects alone.
Monitoring and Measurement Techniques for Greenhouse Gases
Satellite-based remote sensing and ground-based spectroscopy are vital for monitoring atmospheric methane, complementing the Keeling Curve's precise CO2 measurements to track greenhouse gas trends. Advanced instruments like the Total Carbon Column Observing Network (TCCON) provide high-resolution methane data, enabling detection of emission hotspots and temporal variability. Integration of these techniques enhances accuracy in quantifying methane sources and sinks, critical for climate change mitigation strategies.
Future Outlook: Mitigation Strategies for Methane and CO₂
Rising atmospheric methane concentrations, closely monitored alongside the Keeling Curve's CO2 data, underscore the urgent need for targeted mitigation strategies to limit global warming. Effective approaches include reducing emissions from agriculture, fossil fuel extraction, and waste management, leveraging advanced methane detection technologies and promoting policies for carbon capture and utilization. Integrating methane mitigation with CO2 reduction efforts enhances climate stabilization prospects and supports meeting international targets such as the Paris Agreement.
Atmospheric methane trends Infographic