The global carbon budget quantifies the amount of carbon dioxide emissions our atmosphere can absorb without causing dangerous climate change. Understanding this budget helps policymakers and scientists track progress toward emission reduction targets and climate goals. Explore the full article to learn how your actions can influence the global carbon budget and contribute to a sustainable future.
Table of Comparison
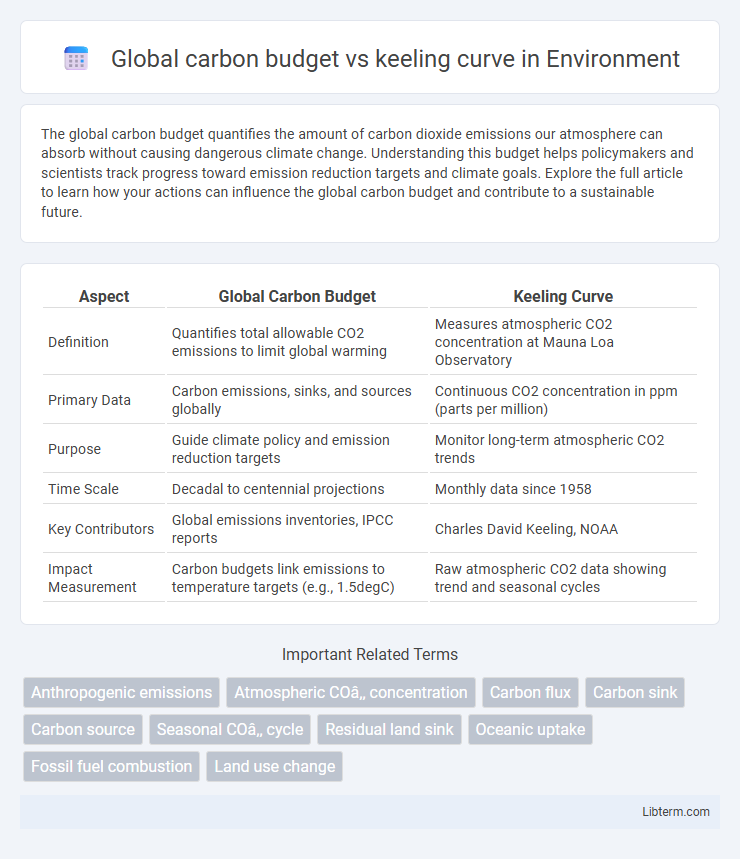
| Aspect | Global Carbon Budget | Keeling Curve |
|---|---|---|
| Definition | Quantifies total allowable CO2 emissions to limit global warming | Measures atmospheric CO2 concentration at Mauna Loa Observatory |
| Primary Data | Carbon emissions, sinks, and sources globally | Continuous CO2 concentration in ppm (parts per million) |
| Purpose | Guide climate policy and emission reduction targets | Monitor long-term atmospheric CO2 trends |
| Time Scale | Decadal to centennial projections | Monthly data since 1958 |
| Key Contributors | Global emissions inventories, IPCC reports | Charles David Keeling, NOAA |
| Impact Measurement | Carbon budgets link emissions to temperature targets (e.g., 1.5degC) | Raw atmospheric CO2 data showing trend and seasonal cycles |
Introduction to the Global Carbon Budget
The Global Carbon Budget quantifies annual carbon dioxide sources and sinks, serving as a critical tool for understanding climate change. It integrates data from fossil fuel emissions, land-use changes, and oceanic absorption, providing a comprehensive overview of anthropogenic impact. This budget complements the Keeling Curve, which tracks atmospheric CO2 concentration growth measured at Mauna Loa Observatory.
Understanding the Keeling Curve
The Keeling Curve represents the continuous measurement of atmospheric CO2 concentrations at Mauna Loa Observatory, providing a precise record of rising carbon dioxide levels since 1958. This curve is essential for understanding the global carbon budget, as it quantifies the net accumulation of CO2 in the atmosphere, reflecting the balance between emissions from fossil fuels, land use, and natural carbon sinks like oceans and forests. Analyzing the Keeling Curve helps scientists track the impact of human activities on climate change and informs strategies to manage carbon emissions within the global carbon budget framework.
Historical Origins of Carbon Measurement
The historical origins of carbon measurement trace back to the Keeling Curve, initiated by Charles David Keeling in 1958, which provided the first continuous record of atmospheric CO2 concentrations at Mauna Loa Observatory. This foundational data established the baseline for understanding the global carbon budget, quantifying carbon sources and sinks essential for tracking anthropogenic emissions and natural fluxes. The integration of Keeling's precise atmospheric measurements with global carbon budget models enables scientists to assess carbon cycle dynamics and guide climate policy decisions effectively.
Key Components of the Global Carbon Budget
The global carbon budget quantifies carbon sources and sinks, tracking emissions from fossil fuels, land-use change, and ocean uptake, essential for understanding atmospheric CO2 levels reflected in the Keeling Curve. Key components include anthropogenic emissions categorized into fossil fuel combustion (about 9-10 GtC per year), land-use changes contributing roughly 1-2 GtC annually, ocean carbon uptake capturing approximately 2-3 GtC, and terrestrial biosphere absorption offsetting 2-3 GtC. These fluxes balance against the measurable increase of CO2 concentrations at Mauna Loa, underpinning climate models and mitigation strategies.
How the Keeling Curve Tracks Atmospheric CO₂ Trends
The Keeling Curve meticulously records atmospheric CO2 concentrations, revealing seasonal fluctuations alongside a consistent upward trend linked to human fossil fuel emissions. This ongoing measurement complements the global carbon budget by quantifying the amount of carbon dioxide accumulating in the atmosphere versus that absorbed by oceans and terrestrial ecosystems. Monitoring these trends through the Keeling Curve enables scientists to assess Earth's carbon sinks' effectiveness and refine climate change mitigation strategies.
Comparing Methodologies: Budget Models vs Observational Data
Global carbon budget models synthesize emissions data from fossil fuels, land-use changes, and oceanic sinks to estimate net carbon fluxes, using complex mathematical frameworks and historical records. The Keeling Curve relies on precise, continuous atmospheric CO2 measurements at Mauna Loa Observatory, providing direct empirical data on concentration changes over time. Comparing these methodologies highlights budget models' integration of diverse carbon sources and sinks versus the Keeling Curve's raw observational accuracy, crucial for validating and refining carbon cycle predictions.
The Role of Oceans and Land in Carbon Balancing
Oceans and land ecosystems play a crucial role in regulating the global carbon budget by absorbing approximately 50% of anthropogenic CO2 emissions annually, which helps mitigate the rise observed in the Keeling Curve. Marine phytoplankton and coastal vegetation act as significant carbon sinks, while terrestrial forests and soils store vast amounts of carbon through photosynthesis and organic matter accumulation. Disruptions to these natural carbon sinks from deforestation, ocean acidification, and climate change pose risks to their capacity, affecting the stability of atmospheric CO2 levels depicted by the Keeling Curve.
Interpreting Keeling Curve Data in a Climate Context
The Keeling Curve, representing atmospheric CO2 concentrations since 1958, provides real-time evidence of rising greenhouse gases linked to fossil fuel emissions tracked in the global carbon budget. This curve highlights seasonal oscillations caused by plant photosynthesis, but its upward trend corresponds directly to human-induced carbon output outpacing natural sinks. Interpreting Keeling Curve data in a climate context is critical for understanding the pace of global carbon accumulation and gauging progress towards emission reduction targets essential for mitigating climate change.
Challenges in Harmonizing Global Carbon Estimates
Disparities between the Global Carbon Budget and the Keeling Curve arise from variations in data collection methods, temporal resolution, and geographic coverage, complicating accurate quantification of atmospheric CO2 concentrations. Challenges in harmonizing these estimates include reconciling fossil fuel emission inventories with atmospheric measurements, accounting for natural carbon sinks and sources, and addressing uncertainties in oceanic and terrestrial carbon fluxes. Effective integration demands standardized protocols and enhanced Earth observation systems to improve consistency and reliability in global carbon accounting.
Implications for Climate Policy and Future Carbon Monitoring
The Global Carbon Budget quantifies annual carbon dioxide emissions and natural carbon sinks, providing a comprehensive overview of sources and sinks that directly complement the Keeling Curve's precise measurement of atmospheric CO2 concentrations. The integration of these datasets enhances climate policy by enabling more accurate emission reduction targets, facilitating verification mechanisms, and informing adaptive strategies aligned with real-time atmospheric trends. Future carbon monitoring must leverage advancements in satellite technology and ground-based sensors to refine emission inventories and improve predictive climate models essential for effective policy-making.
Global carbon budget Infographic