Isohaline lines represent areas on a map where the salinity of water remains constant, providing critical insights into marine and estuarine environments. Understanding these lines helps you monitor changes in salt concentration that affect aquatic ecosystems, water quality, and marine biodiversity. Explore the rest of the article to learn how isohaline mapping supports environmental management and scientific research.
Table of Comparison
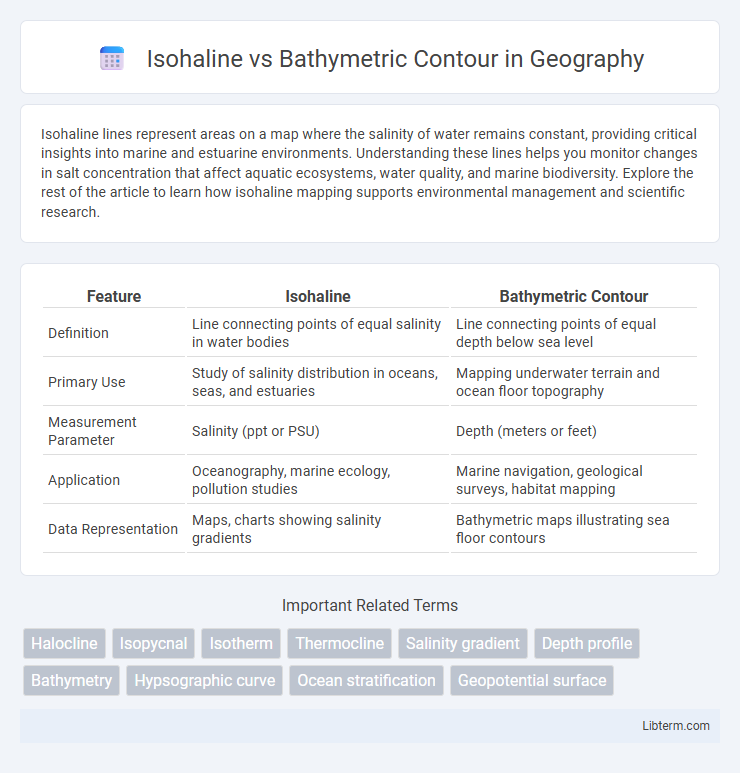
| Feature | Isohaline | Bathymetric Contour |
|---|---|---|
| Definition | Line connecting points of equal salinity in water bodies | Line connecting points of equal depth below sea level |
| Primary Use | Study of salinity distribution in oceans, seas, and estuaries | Mapping underwater terrain and ocean floor topography |
| Measurement Parameter | Salinity (ppt or PSU) | Depth (meters or feet) |
| Application | Oceanography, marine ecology, pollution studies | Marine navigation, geological surveys, habitat mapping |
| Data Representation | Maps, charts showing salinity gradients | Bathymetric maps illustrating sea floor contours |
Introduction to Isohaline and Bathymetric Contour
Isohalines represent lines on a map connecting points of equal salinity, essential for studying variations in ocean water salinity and its impact on marine ecosystems. Bathymetric contours delineate underwater topography by connecting points of equal depth, critical for navigation, geological research, and habitat mapping. Understanding both isohalines and bathymetric contours offers comprehensive insights into marine spatial patterns and environmental processes.
Defining Isohaline: Meaning and Application
Isohalines are lines on a map or chart that connect points of equal salinity in a body of water, often used in oceanography and estuarine studies to analyze salinity distribution. These contours help identify water mass boundaries, freshwater influence, and mixing zones by visually representing variations in salt concentration. Understanding isohaline patterns is essential for managing aquatic ecosystems, monitoring environmental changes, and supporting marine navigation and fisheries.
Understanding Bathymetric Contour: Key Concepts
Bathymetric contour lines represent the underwater topography of ocean or lake floors by connecting points of equal depth, providing essential data for navigation, geological studies, and marine habitat mapping. These contours enable scientists to visualize seabed features such as trenches, ridges, and plateaus, facilitating better understanding of underwater terrain complexity and sediment distribution. Accurate bathymetric mapping is crucial for marine engineering projects, environmental assessments, and resource management in oceanographic research.
Formation and Representation of Isohaline Lines
Isohaline lines represent areas of equal salinity in a body of water, formed due to the mixing of freshwater and seawater, temperature changes, and evaporation processes influencing salinity distribution. These lines are depicted on salinity maps to illustrate horizontal salinity gradients, crucial for understanding water mass characteristics and marine ecology. In contrast, bathymetric contours derive from underwater topography measurements, representing constant depths to map the seafloor's shape without indicating salinity variations.
Determining Bathymetric Contours in Marine Mapping
Determining bathymetric contours in marine mapping involves interpreting isohalines, which represent constant salinity levels, to understand water mass properties and their influence on underwater topography. Isohaline data aids in correlating salinity gradients with seafloor features, enhancing the accuracy of bathymetric contour delineation. Integrating isohaline analysis with sonar and depth sounder readings improves the resolution of bathymetric maps, crucial for navigation and marine resource management.
Differences Between Isohaline and Bathymetric Contours
Isohaline contours represent lines of constant salinity in a body of water, used primarily in oceanography and hydrology to analyze salinity distribution and gradients. Bathymetric contours map the underwater topography, depicting lines of equal depth to illustrate the seabed's shape and terrain features. The key difference lies in their focus: isohaline contours measure water chemistry variations, while bathymetric contours describe physical underwater landscape.
Significance of Isohalines in Oceanography
Isohalines represent lines of equal salinity on oceanographic charts, providing critical information about the distribution and mixing of saltwater masses in marine environments. Their significance lies in tracking water mass movements, identifying salinity gradients, and understanding the impact of freshwater inputs on ocean circulation. Bathymetric contours, by contrast, depict underwater topography and are essential for mapping ocean floor features but do not directly indicate water property variations like salinity.
Role of Bathymetric Contours in Underwater Topography
Bathymetric contours are crucial for mapping underwater topography by depicting the shape and depth of the ocean floor through lines connecting points of equal depth. Unlike isohalines, which represent variations in salinity, bathymetric contours provide detailed information on underwater features such as seamounts, trenches, and continental shelves, essential for navigation, habitat studies, and geological research. These contours enable scientists to understand seabed terrain, influencing ocean currents, marine ecosystems, and sediment transport.
Practical Applications: From Navigation to Research
Isohaline maps, depicting lines of equal salinity concentration, are crucial for marine navigation by helping vessels optimize routes through varying water densities, while bathymetric contours provide detailed underwater topography essential for safe ship maneuvering and submersible operations. In scientific research, isohaline data enable oceanographers to study water mass distribution, salinity gradients, and their effects on marine ecosystems, whereas bathymetric contours support habitat mapping, sediment transport analysis, and underwater geological investigations. These complementary tools enhance both practical maritime activities and advanced oceanographic research by providing precise environmental metrics.
Summary: Comparing Isohaline and Bathymetric Contour
Isohaline maps display lines of constant salinity, essential for studying oceanographic salinity variations and marine ecosystems. Bathymetric contour maps depict underwater topography, outlining depths and shapes of ocean floors critical for navigation and habitat identification. Comparing both, Isohaline charts emphasize chemical properties of seawater while Bathymetric contours focus on physical spatial features beneath the water surface.
Isohaline Infographic