Dot distribution maps visually represent spatial patterns by placing dots to indicate the presence or quantity of a particular variable in specific locations. This technique effectively highlights concentrations, dispersions, and clusters, making complex geographic data easily comprehensible. Explore the rest of the article to learn how you can create and interpret dot distribution maps for your data analysis.
Table of Comparison
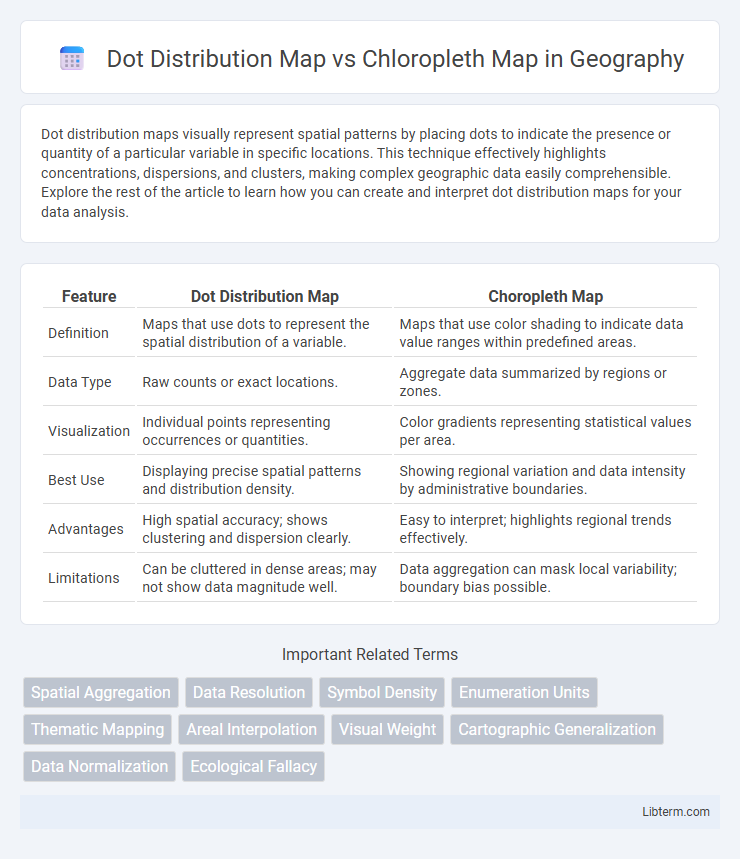
| Feature | Dot Distribution Map | Choropleth Map |
|---|---|---|
| Definition | Maps that use dots to represent the spatial distribution of a variable. | Maps that use color shading to indicate data value ranges within predefined areas. |
| Data Type | Raw counts or exact locations. | Aggregate data summarized by regions or zones. |
| Visualization | Individual points representing occurrences or quantities. | Color gradients representing statistical values per area. |
| Best Use | Displaying precise spatial patterns and distribution density. | Showing regional variation and data intensity by administrative boundaries. |
| Advantages | High spatial accuracy; shows clustering and dispersion clearly. | Easy to interpret; highlights regional trends effectively. |
| Limitations | Can be cluttered in dense areas; may not show data magnitude well. | Data aggregation can mask local variability; boundary bias possible. |
Introduction to Map Visualization Techniques
Dot distribution maps represent data by placing individual dots to indicate the presence and frequency of a phenomenon, providing precise location insights and highlighting spatial patterns within a region. Chloropleth maps use color shading to represent aggregated statistical data over predefined areas such as counties or states, offering an easy visual comparison of density or intensity across regions. Both techniques are essential in geospatial analysis, with dot distribution maps excelling in depicting exact quantities and chloropleth maps enhancing the comprehension of regional trends.
What is a Dot Distribution Map?
A Dot Distribution Map uses dots to represent the frequency or occurrence of a specific phenomenon, with each dot corresponding to a fixed number of data points, allowing for precise spatial distribution visualization. Unlike Choropleth Maps, which use color shading to indicate data density within predefined areas, Dot Distribution Maps offer a more detailed perspective on the exact location and clustering of data points. This method is particularly effective for depicting phenomena such as population density, disease outbreaks, or resource allocation in geographic analysis.
What is a Choropleth Map?
A Choropleth Map is a thematic map that uses varying shades or colors to represent data values across predefined geographic areas, such as counties or states. It effectively visualizes statistical data like population density, income levels, or election results by coloring regions according to data intensity. Unlike Dot Distribution Maps that use dots to indicate precise locations, Choropleth Maps emphasize data patterns and trends over spatial details within boundaries.
Key Differences Between Dot Distribution and Choropleth Maps
Dot distribution maps use individual dots to represent a specific quantity of a phenomenon, providing precise location-based data and revealing patterns of distribution, while choropleth maps use varying shades of color to represent data aggregated within predefined areas such as counties or states. Dot maps excel at showing exact spatial clustering and density but can become cluttered with large datasets, whereas choropleth maps effectively illustrate regional trends and comparisons but may obscure local variability and imply uniformity within zones. The choice between these maps depends on the nature of the data and the level of spatial detail required for accurate interpretation.
Data Representation: Dots vs Color Shades
Dot distribution maps represent data using individual points, where each dot corresponds to a specific quantity, allowing precise location visualization of occurrences. Choropleth maps use color shades to indicate data density within predefined areas, providing a generalized view of spatial patterns based on aggregated data. The choice between dots and color shades depends on whether the goal is to highlight exact locations or summarize regional data trends.
Appropriate Data Types for Each Map
Dot distribution maps are ideal for representing discrete data points such as exact locations of events, population counts, or individual occurrences, offering precise spatial distribution visualization. Choropleth maps are more suitable for continuous or aggregated data like population density, average income, or rates within predefined geographic areas, using color gradients to indicate intensity or magnitude. Choosing the appropriate map depends on whether the data is point-based or area-based, ensuring accurate and meaningful interpretation.
Advantages of Dot Distribution Maps
Dot distribution maps provide precise spatial patterns by representing individual occurrences, allowing for more detailed analysis of density and distribution compared to chloropleth maps. They avoid the issue of data generalization within administrative boundaries, offering a clearer visualization of clusters and gaps. This method effectively highlights population or event concentrations without misleading uniform color shading.
Advantages of Choropleth Maps
Choropleth maps allow for clear visualization of data patterns and regional variations by shading areas based on data intensity, making them ideal for representing demographic, economic, or health statistics across defined geographic boundaries. They simplify complex datasets by providing an immediate visual summary, enhancing interpretability for users. This method also supports easy comparison between regions, facilitating data-driven decision-making and effective communication of spatial trends.
Common Applications and Use Cases
Dot distribution maps excel in visualizing the precise location and density of individual occurrences, making them ideal for epidemiology studies and crime incident analysis. Choropleth maps effectively represent aggregated data across geographic regions, commonly used for demographic statistics, election results, and economic indicators. Both map types enhance spatial analysis by providing clear, interpretable patterns suited for public health, urban planning, and resource allocation.
Choosing the Right Map for Your Data
Choosing the right map type depends on the nature of your data and the level of detail you wish to convey. Dot distribution maps excel at showing precise locations and frequencies of individual occurrences, making them ideal for point-specific datasets such as crime incidents or store locations. Chloropleth maps are better suited for representing aggregated data over predefined areas, like population density or average income, as they use varying color intensities to illustrate regional variations.
Dot Distribution Map Infographic