A contour map uses continuous lines to represent elevation or depth on a two-dimensional surface, making it easier to understand terrain features such as hills, valleys, and slopes. These maps are essential tools in geography, engineering, and outdoor activities for visualizing landforms and planning routes. Explore the article to discover how contour maps can enhance your understanding of geographical landscapes.
Table of Comparison
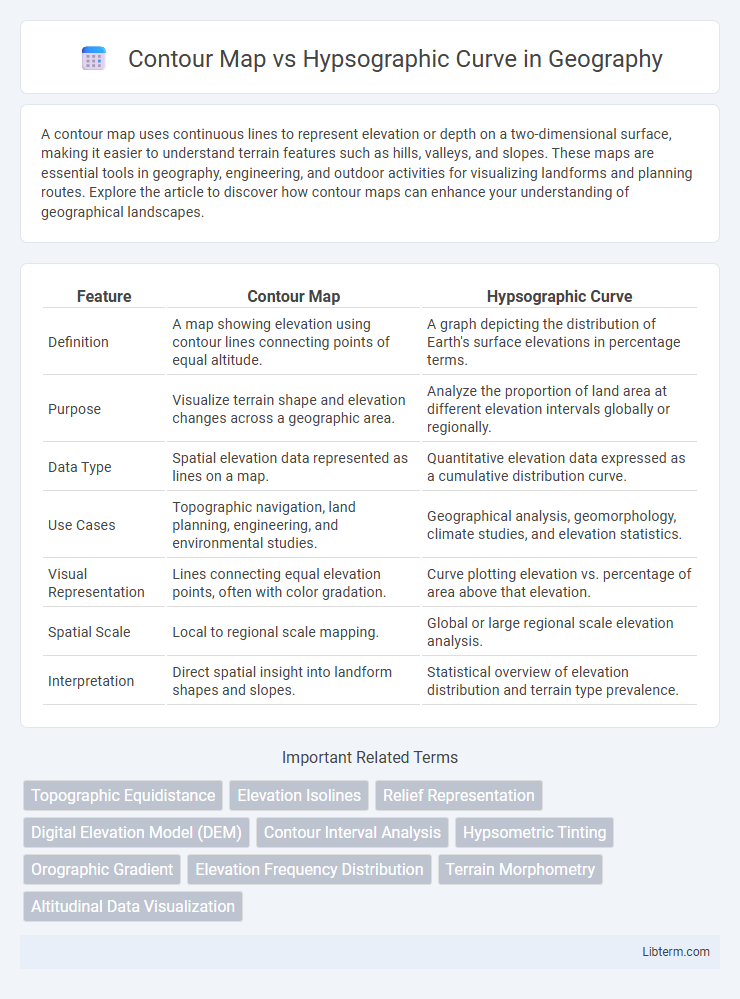
| Feature | Contour Map | Hypsographic Curve |
|---|---|---|
| Definition | A map showing elevation using contour lines connecting points of equal altitude. | A graph depicting the distribution of Earth's surface elevations in percentage terms. |
| Purpose | Visualize terrain shape and elevation changes across a geographic area. | Analyze the proportion of land area at different elevation intervals globally or regionally. |
| Data Type | Spatial elevation data represented as lines on a map. | Quantitative elevation data expressed as a cumulative distribution curve. |
| Use Cases | Topographic navigation, land planning, engineering, and environmental studies. | Geographical analysis, geomorphology, climate studies, and elevation statistics. |
| Visual Representation | Lines connecting equal elevation points, often with color gradation. | Curve plotting elevation vs. percentage of area above that elevation. |
| Spatial Scale | Local to regional scale mapping. | Global or large regional scale elevation analysis. |
| Interpretation | Direct spatial insight into landform shapes and slopes. | Statistical overview of elevation distribution and terrain type prevalence. |
Introduction to Contour Maps and Hypsographic Curves
Contour maps visually represent terrain elevation through continuous lines connecting points of equal height, allowing for detailed interpretation of landforms and slope gradients. Hypsographic curves graphically display the distribution of Earth's surface elevations by plotting cumulative area against elevation, highlighting the proportion of land at various altitudes. Both tools provide essential insights for geomorphology, topographic analysis, and environmental planning.
Definition of Contour Map
A contour map is a graphical representation illustrating elevation or depth through continuous lines connecting points of equal value, typically used in topography to depict terrain features. This map provides detailed information on the shape and slope of the land surface, enabling easier analysis of geographic and geological features. In contrast, a hypsographic curve presents the distribution of Earth's surface elevations in a cumulative frequency graph, summarizing terrain elevation data rather than detailing specific spatial patterns.
Definition of Hypsographic Curve
The hypsographic curve represents the distribution of Earth's surface elevations relative to sea level, illustrating the proportion of land area at various altitudes. Unlike contour maps, which use lines to indicate elevation changes spatially, hypsographic curves provide a graphical summary of elevation frequency across a region. This curve is essential for understanding global topography, highlighting features like continental elevations and ocean depths.
Key Differences Between Contour Map and Hypsographic Curve
Contour maps visually represent terrain elevation using continuous lines connecting points of equal altitude, highlighting detailed topographic features and landscape variations. Hypsographic curves display the cumulative distribution of Earth's surface elevations by plotting land area against altitude, providing a statistical overview of elevation data rather than spatial detail. The primary difference lies in contour maps offering precise spatial information for specific locations, while hypsographic curves summarize elevation patterns across broader regions or entire landmasses.
Applications of Contour Maps
Contour maps are extensively used in topographic analysis, urban planning, and environmental management for visualizing elevation changes and terrain features. Engineers and architects rely on contour maps to design infrastructure projects by assessing slope stability and drainage patterns. In agriculture, contour maps assist in soil conservation and irrigation planning by identifying water flow and preventing erosion.
Applications of Hypsographic Curves
Hypsographic curves play a crucial role in geological and environmental studies by illustrating the distribution of elevations across landforms, assisting in watershed management and flood risk assessment. These curves aid urban planners and engineers in designing infrastructure by providing insights into terrain elevation variability and potential erosion patterns. In climate science, hypsographic data support habitat modeling and biodiversity conservation by correlating elevation with vegetation zones and species distribution.
Advantages of Using Contour Maps
Contour maps provide a detailed and intuitive visualization of terrain elevation by connecting points of equal height, enabling precise identification of landforms and slope gradients. They facilitate efficient route planning, engineering design, and environmental analysis through clear spatial representation of elevation changes. Compared to hypsographic curves, contour maps offer more practical, immediate insight into topography for field applications and decision-making processes.
Advantages of Using Hypsographic Curves
Hypsographic curves provide a clear visualization of the distribution of land elevations relative to sea level, enabling easier interpretation of terrain characteristics and landform distribution compared to the detailed yet complex contour maps. These curves simplify analysis by summarizing elevation data into an easily understandable format, facilitating comparisons between different geographic regions. Their ability to represent elevation frequency is crucial for applications in geomorphology, hydrology, and environmental planning.
Limitations of Contour Maps vs Hypsographic Curves
Contour maps provide detailed spatial representation of terrain elevation but struggle with accurately depicting vertical exaggerations and subtle elevation changes. Hypsographic curves excel at summarizing elevation distribution across a region but lack the precise spatial context and detailed topographic variations offered by contour maps. The limitation of contour maps lies in their complexity and potential for misinterpretation in highly variable landscapes, whereas hypsographic curves cannot convey exact location-specific elevation data.
Choosing the Right Tool: Contour Map or Hypsographic Curve
Choosing between a contour map and a hypsographic curve depends on the specific terrain analysis goals and data visualization needs. A contour map excels in representing terrain elevation and landscape features spatially, allowing detailed, on-site topographic interpretation. The hypsographic curve is ideal for statistical elevation distribution analysis across a region, offering insights into the proportion of land area at varying altitudes for geological or environmental studies.
Contour Map Infographic