Bathymetric curves represent underwater topography by illustrating depth contours, providing crucial data for navigation, marine research, and environmental studies. These curves help visualize the variations in seafloor elevation, enabling accurate mapping of ocean basins, lakes, and riverbeds. Explore the rest of the article to understand how bathymetric curves can enhance your knowledge of aquatic landscapes.
Table of Comparison
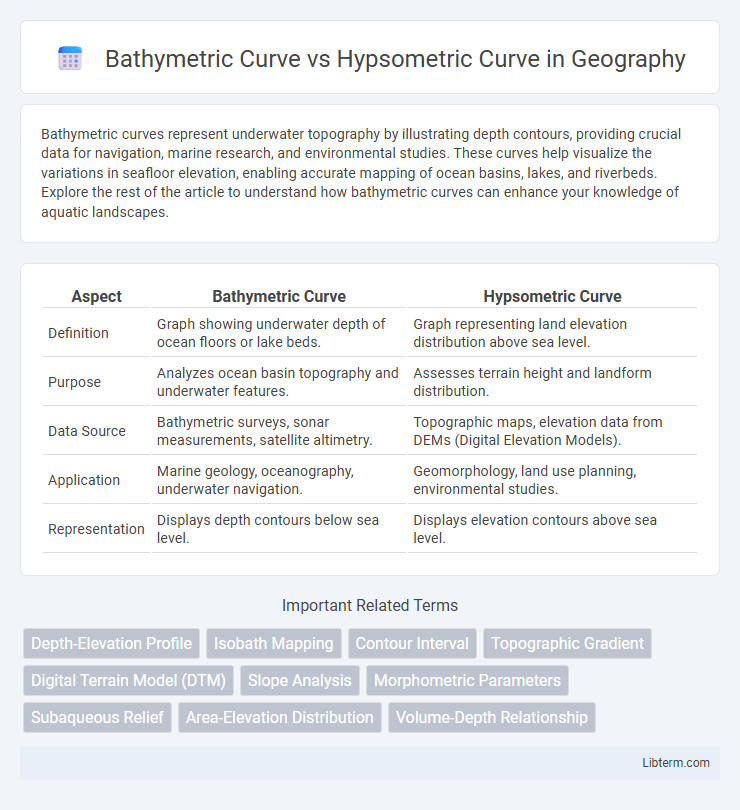
| Aspect | Bathymetric Curve | Hypsometric Curve |
|---|---|---|
| Definition | Graph showing underwater depth of ocean floors or lake beds. | Graph representing land elevation distribution above sea level. |
| Purpose | Analyzes ocean basin topography and underwater features. | Assesses terrain height and landform distribution. |
| Data Source | Bathymetric surveys, sonar measurements, satellite altimetry. | Topographic maps, elevation data from DEMs (Digital Elevation Models). |
| Application | Marine geology, oceanography, underwater navigation. | Geomorphology, land use planning, environmental studies. |
| Representation | Displays depth contours below sea level. | Displays elevation contours above sea level. |
Introduction to Bathymetric and Hypsometric Curves
Bathymetric curves represent the variation of underwater depth and contour lines of ocean floors, lakes, or other water bodies, providing critical data for marine navigation and geological studies. Hypsometric curves illustrate the distribution of land elevation above sea level, helping to analyze terrain relief and watershed characteristics. Both curves are essential tools in geomorphology and environmental science for understanding topographical and submarine features.
Defining Bathymetric Curve: Key Concepts
A bathymetric curve represents the underwater topography of ocean floors, illustrating depth variations and the shape of submerged terrain using contour lines or color gradients. It provides critical data for understanding seafloor features such as continental shelves, slopes, trenches, and abyssal plains. Bathymetric curves are essential for marine navigation, geological research, and habitat mapping, offering precise measurements of ocean depth that differ fundamentally from hypsometric curves, which depict elevation on land.
Understanding Hypsometric Curve: Essential Elements
The hypsometric curve represents the distribution of elevation across a landscape, plotting cumulative area against altitude to reveal landform characteristics and erosion stages. Essential elements include maximum elevation, minimum elevation, and relative relief, which provide insight into topographic maturity and terrain shape. Understanding the hypsometric curve aids in geomorphological analysis and comparison of different drainage basins or regions.
Differences Between Bathymetric and Hypsometric Curves
Bathymetric curves represent the depth distribution of underwater terrain, illustrating the relationship between water depth and the area covered at each depth, while hypsometric curves depict the distribution of land elevation relative to sea level. The primary difference lies in their respective focus; bathymetric curves analyze ocean floor topography, typically measured using sonar data, whereas hypsometric curves analyze terrestrial elevation profiles utilizing topographic measurements. These curves are essential in geomorphology for understanding underwater relief versus land surface elevation, influencing studies in oceanography and landform analysis.
Applications of Bathymetric Curves in Oceanography
Bathymetric curves provide crucial data for mapping and analyzing underwater topography, essential in oceanography for understanding seafloor morphology and sediment distribution. These curves aid in navigation safety by identifying depth variations and potential hazards, facilitating the planning of submarine cables and pipelines. Bathymetric data also supports marine habitat studies, enabling scientists to correlate depth zones with biological communities and oceanographic processes.
Uses of Hypsometric Curves in Geomorphology
Hypsometric curves are essential in geomorphology for analyzing the distribution of land elevation relative to area, which helps in understanding landscape development and erosion processes. These curves reveal the stages of terrain maturity and the proportion of different elevation ranges, aiding in watershed management and geomorphic classification. Bathymetric curves, by contrast, depict underwater depth profiles and are primarily used in oceanography rather than landform studies.
Data Collection Methods for Bathymetric Analysis
Bathymetric analysis relies on data collected through sonar technology, such as multibeam and single-beam echo sounders, which emit sound waves to measure water depth and map underwater topography accurately. Satellite altimetry also supplements bathymetric data by measuring sea surface height variations influenced by underwater features, enhancing large-scale bathymetric mapping. Unlike hypsometric curves based on land elevation data obtained using GPS, LiDAR, and topographic surveys, bathymetric curves depend heavily on marine acoustic sensing techniques for precise seabed profiling.
Techniques for Plotting Hypsometric Curves
Techniques for plotting hypsometric curves involve analyzing elevation data from topographic maps or digital elevation models (DEMs) to quantify the distribution of land surface elevations. This process typically requires calculating the relative area corresponding to specific elevation intervals and plotting cumulative area percentages against elevation values to visualize landscape morphology. Advanced methods employ Geographic Information Systems (GIS) for automated extraction and precise calculation of elevation-area relationships, enhancing the accuracy of hypsometric curve generation compared to traditional manual approaches.
Comparative Case Studies: Bathymetric vs Hypsometric
Comparative case studies between bathymetric and hypsometric curves reveal distinct applications in topographic and oceanographic analysis. Bathymetric curves map underwater depth variations, essential for marine navigation and seabed morphology, whereas hypsometric curves illustrate land elevation distribution, critical for watershed and geomorphological studies. Analyzing both curves across diverse landscapes enhances understanding of elevation patterns and submerged terrain, supporting environmental management and geological assessments.
Future Trends in Elevation and Depth Profiling
Future trends in elevation and depth profiling emphasize enhanced accuracy and resolution through advancements in LiDAR and sonar technologies, enabling more detailed bathymetric and hypsometric curve generation. Integration of AI and machine learning algorithms allows for real-time data processing and predictive modeling, improving the interpretation of seabed and terrain morphologies. Emerging multi-sensor platforms and autonomous underwater vehicles (AUVs) are expanding spatial coverage and data granularity, driving innovations in geospatial analysis and environmental monitoring.
Bathymetric Curve Infographic