Contour maps visually represent elevation differences using lines that connect points of equal height, helping to interpret the terrain's shape and slope effectively. These maps are essential tools in geography, hiking, urban planning, and environmental studies, offering detailed insights into landforms and topography. Explore the rest of the article to understand how contour maps can enhance your navigation and planning skills.
Table of Comparison
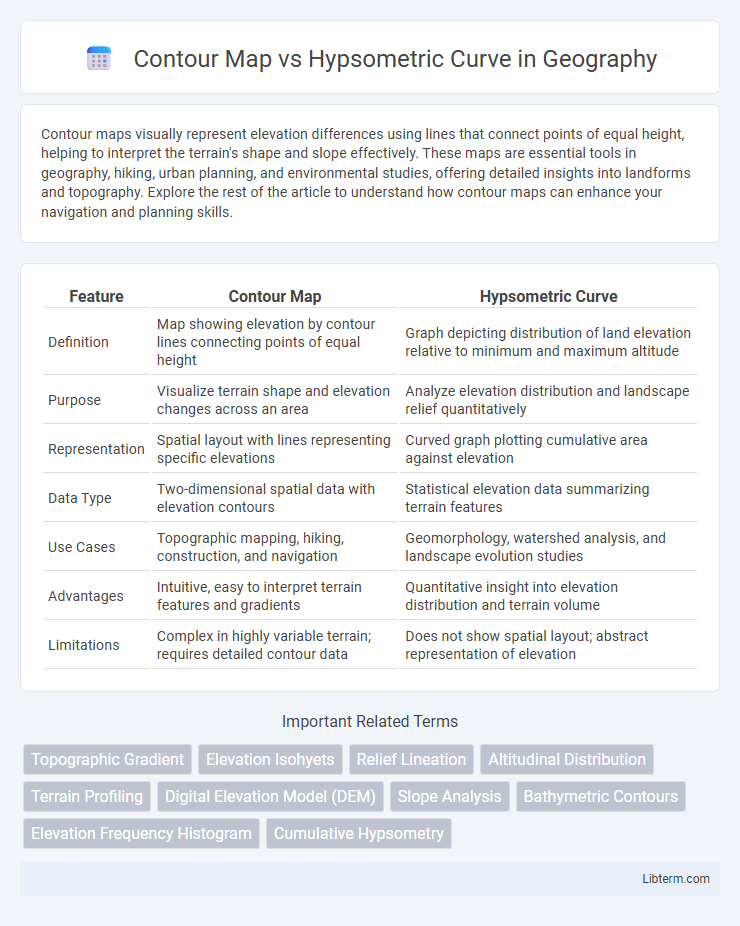
| Feature | Contour Map | Hypsometric Curve |
|---|---|---|
| Definition | Map showing elevation by contour lines connecting points of equal height | Graph depicting distribution of land elevation relative to minimum and maximum altitude |
| Purpose | Visualize terrain shape and elevation changes across an area | Analyze elevation distribution and landscape relief quantitatively |
| Representation | Spatial layout with lines representing specific elevations | Curved graph plotting cumulative area against elevation |
| Data Type | Two-dimensional spatial data with elevation contours | Statistical elevation data summarizing terrain features |
| Use Cases | Topographic mapping, hiking, construction, and navigation | Geomorphology, watershed analysis, and landscape evolution studies |
| Advantages | Intuitive, easy to interpret terrain features and gradients | Quantitative insight into elevation distribution and terrain volume |
| Limitations | Complex in highly variable terrain; requires detailed contour data | Does not show spatial layout; abstract representation of elevation |
Introduction to Contour Maps and Hypsometric Curves
Contour maps represent terrain elevations through lines connecting points of equal altitude, enabling detailed visualization of landscape features and slope gradients. Hypsometric curves illustrate the distribution of land elevation by plotting the proportion of area against altitude, providing insights into the geomorphological characteristics of a region. Both tools are essential for topographic analysis, with contour maps offering spatial orientation and hypsometric curves revealing elevation-area relationships.
Definition of Contour Maps
Contour maps, also known as topographic maps, represent the Earth's surface by using continuous lines called contour lines that connect points of equal elevation, illustrating the shape and elevation of landforms. These maps provide a detailed visual of terrain relief, slopes, and elevation changes, essential for geographic analysis, environmental planning, and engineering projects. Unlike hypsometric curves, which graphically depict the distribution of elevations across an area in a cumulative form, contour maps offer spatially explicit and precise elevation data for navigation and land use planning.
Definition of Hypsometric Curves
Hypsometric curves represent the distribution of land elevation relative to sea level within a specific area, illustrating the proportion of a landscape at different elevation intervals. Unlike contour maps that use lines to depict terrain elevation at consistent intervals, hypsometric curves provide a graphical summary of the overall topographic profile, showing the cumulative area below each elevation. These curves are essential in geomorphology and watershed analysis for understanding terrain shape, erosion stages, and landscape evolution.
Key Differences Between Contour Maps and Hypsometric Curves
Contour maps represent elevation through continuous lines connecting points of equal altitude, providing a detailed view of terrain shape and slope. Hypsometric curves illustrate the distribution of area across various elevations within a region, offering insights into the relative proportions of land at different heights. While contour maps emphasize spatial topography, hypsometric curves focus on quantitative analysis of elevation frequency and landscape morphology.
Applications of Contour Maps in Geography
Contour maps play a crucial role in geography by visually representing elevation and terrain features, aiding in topographic analysis and land use planning. They are extensively used in hydrology for watershed delineation, soil conservation, and flood risk assessment. These maps also facilitate infrastructure development by providing essential data for designing roads, buildings, and other civil engineering projects.
Uses of Hypsometric Curves in Terrain Analysis
Hypsometric curves are essential in terrain analysis for assessing the stage of landscape evolution and identifying erosion and deposition patterns. They provide a graphical representation of the distribution of elevation relative to total relief, enabling geologists to interpret geomorphic processes and watershed development. Unlike contour maps, which depict elevation lines on the ground surface, hypsometric curves summarize elevation data volumetrically, offering insights into basin maturity and sediment yield.
Advantages and Limitations of Contour Maps
Contour maps provide precise elevation data through continuous lines connecting points of equal altitude, enabling detailed topographic analysis and navigation. They effectively represent terrain shape and slope gradients but can become cluttered and difficult to interpret in areas with complex or densely varying elevations. Limited in conveying three-dimensional visual impact, contour maps require expertise to accurately read and can miss subtle elevation nuances without fine contour interval adjustments.
Advantages and Limitations of Hypsometric Curves
Hypsometric curves provide a clear visualization of the distribution of elevations within a given area, making it easier to interpret the overall terrain characteristics compared to contour maps. They effectively highlight the balance between lowlands, midlands, and highlands, which aids in geomorphological and watershed analysis. However, hypsometric curves lack spatial orientation and detail, limiting their use in precise location-based studies where contour maps excel.
How to Interpret Contour Maps vs Hypsometric Curves
Contour maps represent elevation using continuous lines that connect points of equal altitude, enabling the visualization of terrain shape and slope steepness through line density and spacing. Hypsometric curves display the distribution of elevation across a specific area by plotting the proportion of land area at different heights, highlighting overall terrain relief and elevation variability. Interpreting contour maps involves analyzing line patterns to identify features such as ridges and valleys, while hypsometric curves are read to assess the relative dominance of low or high elevations and the extent of erosion or uplift in a landscape.
Choosing Between Contour Maps and Hypsometric Curves
Contour maps provide detailed elevation information through lines representing constant altitude, making them ideal for precise terrain analysis and navigation. Hypsometric curves summarize elevation distribution by showing the proportion of land area at various heights, useful for understanding landscape characteristics and watershed management. Choosing between them depends on whether detailed spatial elevation data (contour maps) or generalized altitude distribution (hypsometric curves) best suits the specific geographic or environmental analysis.
Contour Map Infographic