Digital Elevation Models (DEMs) provide detailed 3D representations of terrain elevations essential for geographic analysis, urban planning, and environmental studies. Accurate DEMs enhance the precision of flood risk mapping, landform classification, and infrastructure design processes. Discover how DEMs can transform your spatial data projects by exploring the full article.
Table of Comparison
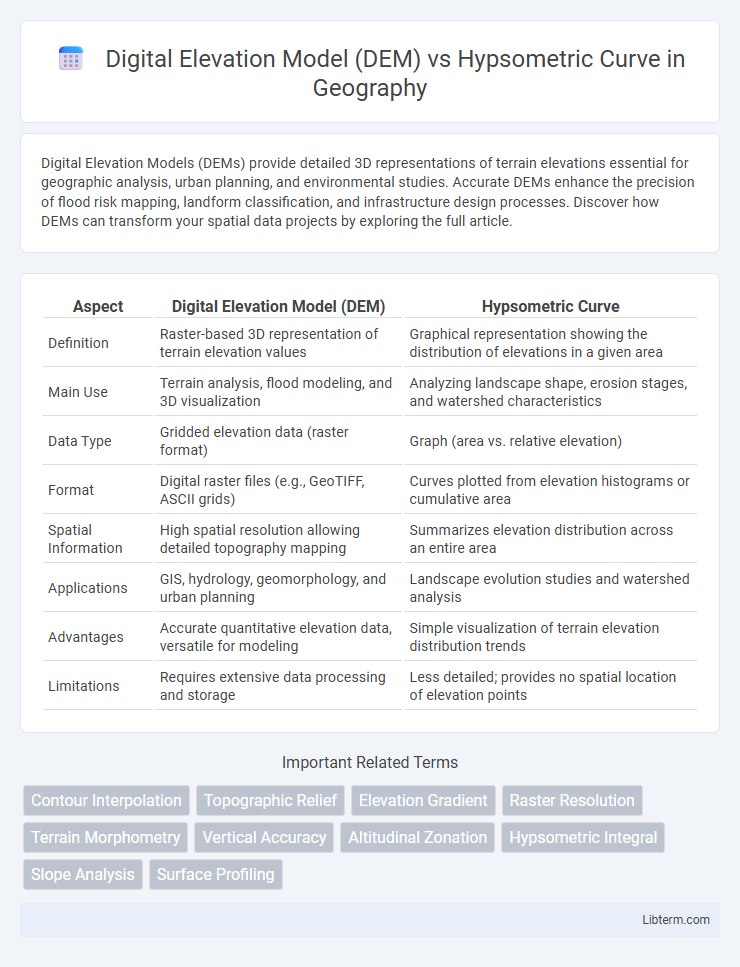
| Aspect | Digital Elevation Model (DEM) | Hypsometric Curve |
|---|---|---|
| Definition | Raster-based 3D representation of terrain elevation values | Graphical representation showing the distribution of elevations in a given area |
| Main Use | Terrain analysis, flood modeling, and 3D visualization | Analyzing landscape shape, erosion stages, and watershed characteristics |
| Data Type | Gridded elevation data (raster format) | Graph (area vs. relative elevation) |
| Format | Digital raster files (e.g., GeoTIFF, ASCII grids) | Curves plotted from elevation histograms or cumulative area |
| Spatial Information | High spatial resolution allowing detailed topography mapping | Summarizes elevation distribution across an entire area |
| Applications | GIS, hydrology, geomorphology, and urban planning | Landscape evolution studies and watershed analysis |
| Advantages | Accurate quantitative elevation data, versatile for modeling | Simple visualization of terrain elevation distribution trends |
| Limitations | Requires extensive data processing and storage | Less detailed; provides no spatial location of elevation points |
Introduction to Digital Elevation Models (DEM)
Digital Elevation Models (DEMs) represent terrain elevations using a grid of regularly spaced points, providing detailed three-dimensional surface data essential for topographic analysis and environmental modeling. DEMs enable precise calculations of slope, aspect, and watershed boundaries, offering foundational input for geographic information systems (GIS) and remote sensing applications. Unlike hypsometric curves, which graphically depict elevation distribution over an area, DEMs deliver explicit numerical elevation values crucial for spatial analysis and terrain visualization.
Defining Hypsometric Curves
Hypsometric curves represent the distribution of elevations in a given terrain by plotting the proportion of land area against relative elevation levels, providing insights into landscape morphology and geomorphological stages. Unlike Digital Elevation Models (DEMs), which offer detailed raster-based elevation data, hypsometric curves summarize elevation data into a compact, interpretable graph that highlights the area-elevation relationship. These curves are essential for analyzing watershed characteristics, erosion stages, and sediment transport processes in geomorphology.
Key Differences Between DEM and Hypsometric Curve
Digital Elevation Models (DEMs) provide a detailed 3D representation of terrain elevation using raster grids with precise spatial resolution, essential for terrain analysis and modeling. Hypsometric curves graphically depict the distribution of elevations within a specific area, offering insights into landscape shape and erosion stages by plotting the proportion of land area above various elevations. The key difference lies in DEMs presenting raw elevation data with spatial context, while hypsometric curves summarize this data to analyze geomorphological characteristics and watershed development.
Data Sources for DEM and Hypsometric Curve
Digital Elevation Models (DEMs) are primarily generated using remote sensing technologies such as LiDAR, photogrammetry, and satellite radar like SRTM or ASTER, providing high-resolution elevation data critical for topographic analysis. Hypsometric curves derive from elevation data typically extracted from DEMs or contour maps, representing the distribution of terrain elevations within a given area. The accuracy of hypsometric curves depends heavily on the quality and resolution of the underlying DEM or topographic data used in their creation.
Generation and Processing Techniques
Digital Elevation Models (DEMs) are generated using remote sensing technologies such as LiDAR, photogrammetry, and radar interferometry, providing high-resolution raster data representing terrain elevations. Hypsometric curves are derived from DEM data through spatial analysis techniques that plot the proportion of area at various elevations, often involving GIS tools for terrain classification and volumetric calculations. Processing DEMs requires filtering, interpolation, and error correction to create accurate elevation representations, while hypsometric curve generation involves extracting elevation frequency distributions and normalizing cumulative area against elevation.
Applications in Geomorphology
Digital Elevation Models (DEMs) provide high-resolution, three-dimensional representations of terrain surfaces, enabling detailed analysis of landform features, watershed delineation, and slope stability assessments in geomorphology. Hypsometric curves summarize the distribution of elevations within a catchment area, offering insights into landscape maturity, erosion processes, and tectonic activity by illustrating the relationship between surface area and elevation. Combining DEMs with hypsometric curve analysis enhances geomorphological applications by allowing precise quantification of terrain characteristics and better understanding of geomorphic evolution and landform development.
Visualization and Interpretation Methods
Digital Elevation Models (DEMs) provide a detailed, grid-based representation of terrain elevations ideal for precise 3D visualization and spatial analysis, allowing for techniques such as hillshade, slope, and aspect mapping to interpret landscape features. Hypsometric curves graphically represent the distribution of elevation across a watershed or region by plotting area against elevation, facilitating the interpretation of landscape maturity and erosion stages. Visualization of DEMs often involves GIS software for interactive terrain modeling, while hypsometric curves rely on statistical plotting to interpret geomorphological characteristics.
Limitations and Challenges
Digital Elevation Models (DEMs) often face limitations such as resolution constraints, data artifacts, and inaccuracies in capturing complex terrain features, which can impact hydrological modeling and landform analysis. Hypsometric curves, while useful for representing the distribution of elevation within a basin, are limited by their reliance on aggregated elevation data, potentially oversimplifying terrain variability and making it challenging to detect localized geomorphological changes. Both tools encounter challenges related to scale dependency, data quality, and integration with other geospatial datasets, affecting their precision and applicability in environmental and geomorphic research.
Integration of DEM and Hypsometric Analysis
Integration of Digital Elevation Model (DEM) with hypsometric curve analysis enhances the accuracy of terrain evaluation by providing detailed elevation data crucial for generating precise hypsometric curves. DEM offers high-resolution spatial elevation points that improve the assessment of watershed morphology and landscape evolution when combined with hypsometric analysis. This synergy supports advanced geomorphological studies and hydrological modeling by enabling comprehensive visualization and quantification of elevation distribution across various landforms.
Future Trends in Elevation Data and Hypsometry
Future trends in elevation data and hypsometry emphasize the integration of high-resolution Digital Elevation Models (DEMs) generated from LiDAR and satellite-based sensors with advanced hypsometric curve analysis for enhanced terrain characterization. Machine learning algorithms are increasingly employed to automate DEM processing and extract hypsometric features, improving the precision of watershed and landscape evolution models. Emerging cloud-based platforms facilitate real-time access to dynamic elevation datasets and hypsometric metrics, supporting more accurate environmental monitoring and decision-making.
Digital Elevation Model (DEM) Infographic