Isolines represent lines on a map connecting points of equal value, such as elevation, temperature, or pressure, effectively visualizing spatial data patterns. They help in understanding terrain features, weather conditions, and scientific measurements by providing a clear, continuous gradient. Explore the rest of this article to discover how isolines enhance your interpretation of geographical and environmental information.
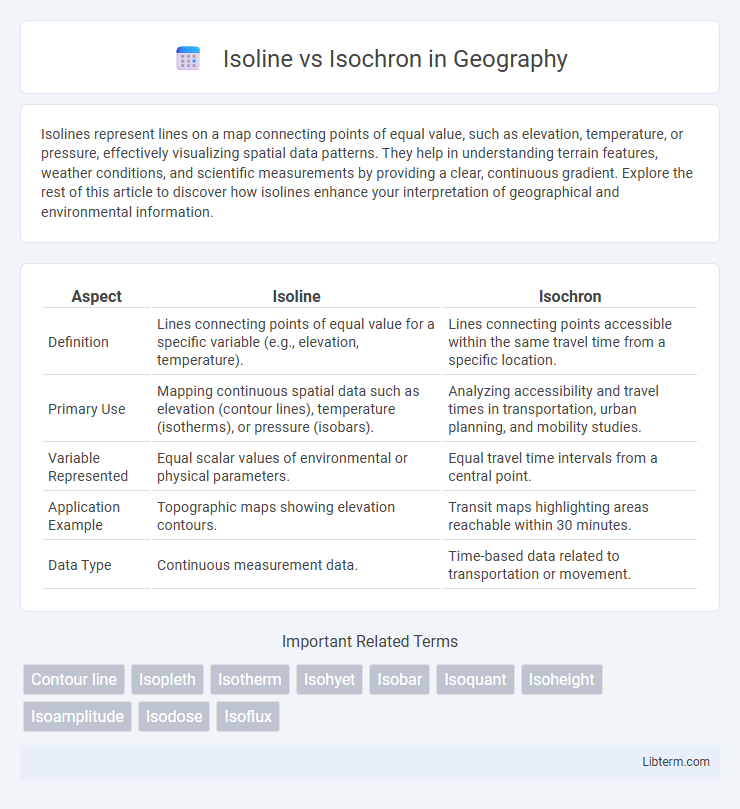
Table of Comparison
| Aspect | Isoline | Isochron |
|---|---|---|
| Definition | Lines connecting points of equal value for a specific variable (e.g., elevation, temperature). | Lines connecting points accessible within the same travel time from a specific location. |
| Primary Use | Mapping continuous spatial data such as elevation (contour lines), temperature (isotherms), or pressure (isobars). | Analyzing accessibility and travel times in transportation, urban planning, and mobility studies. |
| Variable Represented | Equal scalar values of environmental or physical parameters. | Equal travel time intervals from a central point. |
| Application Example | Topographic maps showing elevation contours. | Transit maps highlighting areas reachable within 30 minutes. |
| Data Type | Continuous measurement data. | Time-based data related to transportation or movement. |
Introduction to Isoline and Isochron
Isolines represent lines connecting points of equal value on a map, commonly used in meteorology for temperature or pressure visualization. Isochrons specifically link points accessible within the same travel time, facilitating urban planning and transport analysis. Both tools enhance spatial data interpretation by visually representing temporal or scalar equivalencies across geographic areas.
Defining Isoline: Concept and Applications
An isoline represents a line connecting points of equal value on a map, such as elevation, temperature, or pressure, facilitating visual analysis of spatial patterns. Common applications include topographic maps with contour lines and meteorological charts displaying isobars or isotherms. Isolines enable efficient interpretation of complex geographic data by highlighting gradients and anomalies in continuous fields.
Understanding Isochron: Meaning and Uses
Isochron refers to a line on a map that connects points reachable within the same travel time from a specific location, essential for transportation planning and urban mobility analysis. It differs from isolines, which link points of equal value for variables like elevation or temperature. Isochron maps optimize decision-making by visualizing accessibility and temporal reach, influencing public transit design, emergency response, and real estate development.
Key Differences Between Isoline and Isochron
Isolines represent contours of equal value for a specific variable such as elevation, temperature, or pressure on a map, helping visualize spatial distribution. Isochrons specifically indicate areas accessible within the same travel time or duration from a particular point, often used in transportation or urban planning. The key difference lies in isolines depicting equal variable magnitude, whereas isochrons define equal temporal distance from a location.
Scientific Fields Utilizing Isolines
Isolines, representing lines of equal value such as temperature or elevation, are extensively utilized in meteorology, geography, and oceanography to analyze spatial data patterns and visualize gradients. Scientific fields employ isolines for contour mapping in topography, climate modeling, and environmental monitoring, enhancing precision in data interpretation. The use of isolines in geosciences and environmental studies facilitates accurate predictions and comprehensive spatial analysis.
Isochrons in Geology and Chronology
Isochrons in geology represent lines of equal age on rock formations, enabling precise dating of geological events through radiometric methods. They are crucial in chronostratigraphy for correlating rock layers and understanding Earth's tectonic history. Unlike isolines that map equal values of physical variables, isochrons specifically detail temporal relationships essential for reconstructing the geologic time scale.
Visualization Techniques: Mapping Isolines and Isochrons
Mapping isolines involves drawing contour lines that connect points of equal value, such as elevation or temperature, to create a clear visualization of spatial gradients and patterns. Isochrons map areas reachable within equal travel time intervals from a specific point, often visualized through color gradients or concentric lines on transportation or accessibility maps. Both techniques enhance spatial data interpretation by translating complex datasets into intuitive, easily understandable visual formats for geographic and temporal analysis.
Practical Examples and Case Studies
Isolines represent areas of equal value such as elevation or temperature on a map, commonly used in topographic mapping and weather forecasting to visualize terrain or climate patterns. Isochrons denote lines connecting points accessible within the same travel time from a specific location, crucial in urban planning and public transport optimization to evaluate commuting efficiency and accessibility. Case studies on isochrons include modeling emergency response times in metropolitan areas, while isolines are effectively applied in agricultural zoning to optimize irrigation based on elevation data.
Choosing Between Isolines and Isochrons: Criteria
Choosing between isolines and isochrons depends on the specific spatial analysis goal and data characteristics. Isolines represent lines of equal value, such as elevation or temperature, making them ideal for continuous variable mapping. Isochrons, indicating equal travel time from a point, are preferable for accessibility and transportation studies where temporal distance is critical.
Conclusion: Isoline vs Isochron in Research and Mapping
Isolines and isochrons both serve crucial roles in research and mapping by visually representing data with spatial and temporal dimensions respectively. Isolines effectively illustrate variables such as elevation, temperature, or pressure, enabling precise geographic analysis, whereas isochrons map equal travel or reaction times, facilitating studies in transportation, epidemiology, and urban planning. Selecting between isolines and isochrons depends on the specific research question, as isolines optimize spatial data comprehension while isochrons enhance understanding of temporal accessibility and dynamics.
Isoline Infographic