Flow maps visually represent sequences or processes by connecting steps with arrows, clarifying relationships and progression. They enhance understanding of complex information, making it easier to analyze cause and effect or workflow. Explore the full article to discover how flow maps can optimize your projects and decision-making.
Table of Comparison
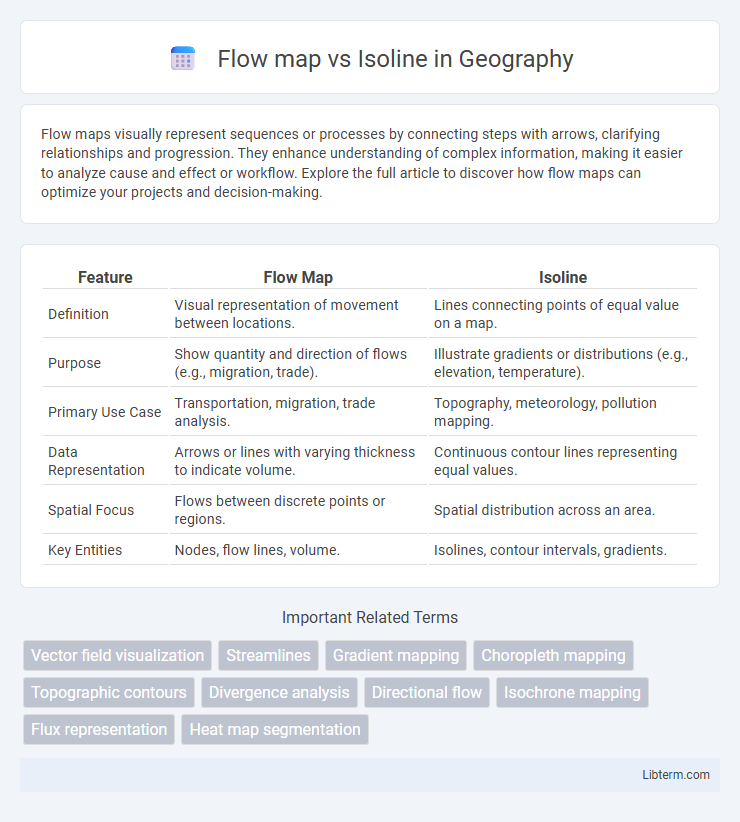
| Feature | Flow Map | Isoline |
|---|---|---|
| Definition | Visual representation of movement between locations. | Lines connecting points of equal value on a map. |
| Purpose | Show quantity and direction of flows (e.g., migration, trade). | Illustrate gradients or distributions (e.g., elevation, temperature). |
| Primary Use Case | Transportation, migration, trade analysis. | Topography, meteorology, pollution mapping. |
| Data Representation | Arrows or lines with varying thickness to indicate volume. | Continuous contour lines representing equal values. |
| Spatial Focus | Flows between discrete points or regions. | Spatial distribution across an area. |
| Key Entities | Nodes, flow lines, volume. | Isolines, contour intervals, gradients. |
Understanding Flow Maps: An Overview
Flow maps visualize movement patterns by depicting directional pathways and quantities, making them essential for analyzing transportation, migration, or trade routes. Isolines represent continuous data fields by connecting points of equal value, commonly used in meteorology and geography to display gradients such as temperature or elevation. Understanding flow maps highlights their capacity to clarify complex flow dynamics through spatial relationships, enabling more intuitive interpretation of movement trends compared to static isoline representations.
What Are Isolines? Definition and Types
Isolines are contour lines on a map that connect points of equal value, representing continuous data in spatial analysis. Common types of isolines include contour lines for elevation, isobars for atmospheric pressure, isotherms for temperature, and isohyets for precipitation. These lines help visualize gradient changes and patterns in geographic data for better interpretation and decision-making.
Key Differences Between Flow Maps and Isolines
Flow maps visualize movement or direction of phenomena such as traffic, migration, or trade flows using arrows or lines that vary in thickness to indicate volume. Isolines represent continuous data fields like elevation, temperature, or pressure by connecting points of equal value with contour lines, emphasizing spatial gradients and patterns. The key difference lies in flow maps depicting directional relationships and quantities, while isolines illustrate spatial distributions and value gradients across a geographic area.
When to Use Flow Maps in Data Visualization
Flow maps visualize movement, such as traffic or migration patterns, by showing directional paths with varying widths to represent volume, making them ideal for analyzing transportation routes or trade flows. Isolines represent continuous data fields like temperature or elevation by connecting points of equal value, which is not suitable for depicting movement. Use flow maps when the primary goal is to display spatial flow dynamics and quantify directional data across geographic regions.
Applications of Isolines in Geographic Analysis
Isolines, such as contour lines and isotherms, are widely used in geographic analysis to represent continuous spatial phenomena like elevation, temperature, and atmospheric pressure. These lines facilitate the visualization of gradients and patterns, enabling precise terrain modeling, climate studies, and meteorological forecasting. Their ability to depict changes smoothly across a landscape makes them essential for environmental monitoring, resource management, and urban planning.
Visualizing Movement: The Purpose of Flow Maps
Flow maps specialize in visualizing movement by illustrating the direction and volume of flows between locations, often using arrows or lines of varying thickness to represent the quantities moving along routes. Isolines, in contrast, depict continuous data such as elevation or temperature by connecting points of equal value, without emphasizing directional movement. The primary purpose of flow maps is to clearly communicate dynamic patterns and relationships in spatial interactions, making them essential for analyzing transportation, migration, and trade flows.
Interpreting Patterns: The Role of Isolines
Isolines, such as contour lines or isobars, represent continuous data values across a spatial surface, making them crucial for interpreting gradients and patterns in geographic phenomena like elevation or temperature. Their ability to connect points of equal value helps users identify areas of increase or decrease and discern spatial trends without visual clutter. Compared to flow maps, which emphasize directional movement, isolines provide a clearer understanding of underlying data distributions and spatial relationships.
Pros and Cons: Flow Maps vs Isolines
Flow maps effectively represent directional movement and volume, making them ideal for visualizing traffic, migration, or supply chains, but can become cluttered and challenging to interpret with dense or overlapping flows. Isolines excel at depicting continuous data such as elevation, temperature, or pressure, providing clear gradient visualization, though they may oversimplify spatial variability and lack directional context. Choosing between flow maps and isolines depends on whether the emphasis is on movement patterns or scalar field distribution, balancing clarity against the complexity of spatial relationships.
Real-World Examples: Flow Maps and Isolines in Action
Flow maps effectively visualize migration patterns by illustrating movement paths and volume between cities, enhancing urban planning decisions. Isolines, such as contour lines on topographic maps, depict elevation changes and are essential in construction and environmental studies for assessing terrain. Both tools enable clear spatial analysis, with flow maps emphasizing directional flow and isolines highlighting continuous value gradients like temperature or altitude.
Choosing the Right Map Type for Your Data
Flow maps are ideal for visualizing movement or migration patterns between locations, emphasizing directional relationships and quantities. Isolines effectively represent continuous spatial data such as elevation, temperature, or pressure, connecting points of equal value to reveal gradients and trends. Selecting the appropriate map depends on whether your primary data highlights flow dynamics or spatial gradients, ensuring accurate interpretation and communication.
Flow map Infographic