Isotherms represent lines on a map or graph that connect points of equal temperature, crucial for understanding temperature distribution across different regions. They are widely used in meteorology, climatology, and engineering to visualize and analyze thermal patterns. Explore this article to discover how isotherms can help you interpret temperature data more effectively.
Table of Comparison
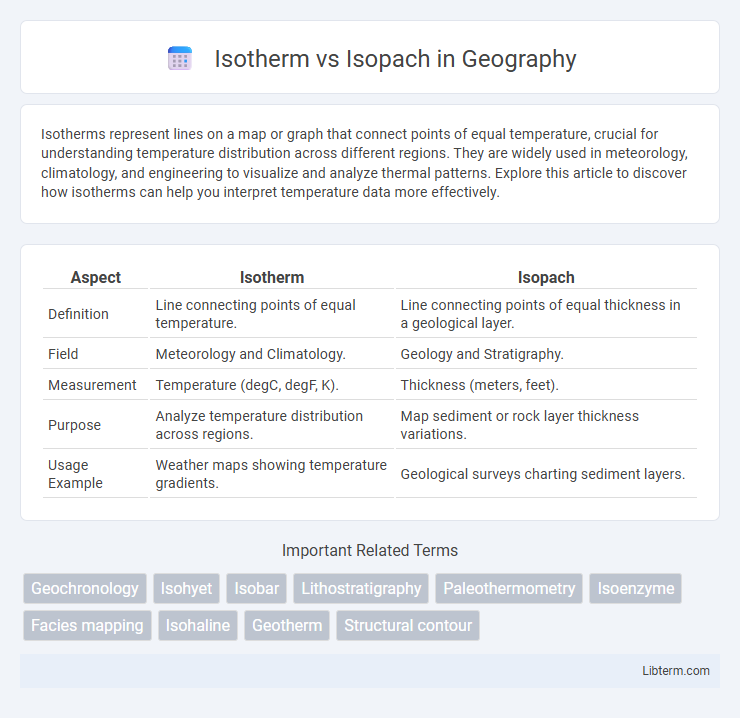
| Aspect | Isotherm | Isopach |
|---|---|---|
| Definition | Line connecting points of equal temperature. | Line connecting points of equal thickness in a geological layer. |
| Field | Meteorology and Climatology. | Geology and Stratigraphy. |
| Measurement | Temperature (degC, degF, K). | Thickness (meters, feet). |
| Purpose | Analyze temperature distribution across regions. | Map sediment or rock layer thickness variations. |
| Usage Example | Weather maps showing temperature gradients. | Geological surveys charting sediment layers. |
Understanding Isotherm and Isopach: Definitions
Isotherms are contour lines connecting points of equal temperature on a map, essential for visualizing temperature distribution in meteorology and geology. Isopachs represent thickness contours of a particular geological layer or sediment, used to analyze deposition patterns and subsurface structures. Understanding the difference between isotherms, which relate to temperature gradients, and isopachs, which indicate layer thickness, is crucial for accurate interpretation in earth sciences.
Key Differences Between Isotherm and Isopach
Isotherms represent lines of constant temperature on a map, crucial for understanding temperature distribution in meteorology and geology, while isopachs depict lines of equal thickness of geological strata, primarily used in sedimentology and stratigraphy. Key differences lie in their data representation: isotherms illustrate thermal gradients, whereas isopachs indicate sediment or rock layer thickness variations. Both are essential in geosciences but serve distinct analytical purposes, with isotherms aiding in climate modeling and isopachs facilitating resource exploration and stratigraphic correlation.
Geological Significance of Isotherms
Isotherms represent lines connecting points of equal temperature within a geological formation, playing a crucial role in understanding geothermal gradients and heat flow in Earth's crust. Their distribution helps identify areas of potential hydrothermal activity, mineralization, and subsurface fluid movement, which are vital for geothermal energy exploration and geological modeling. Unlike isopachs, which map sediment thickness, isotherms reveal thermal regimes essential for assessing rock metamorphism and tectonic processes.
Geological Applications of Isopachs
Isopachs are crucial in geological applications for mapping sediment thickness and stratigraphic layers, providing precise spatial distribution of depositional units. Unlike isotherms that delineate temperature variations, isopachs help determine reservoir volume, hydrocarbon entrapment, and subsurface stratigraphy essential for petroleum geology and sedimentology. Accurate interpretation of isopach maps enhances exploration strategies by identifying structural traps and thickness variations in sedimentary basins.
Methods for Mapping Isotherms
Isotherm mapping involves using temperature data collected from sensors or remote sensing tools to delineate lines of constant temperature across a surface, often employing interpolation techniques like kriging or inverse distance weighting (IDW) to create continuous temperature contours. In contrast, isopach mapping focuses on thickness variations of a geological layer, using data from well logs and seismic surveys to generate contour lines representing constant thickness, typically processed through geostatistical methods and GIS software. While isotherm mapping prioritizes thermal gradients for environmental and meteorological studies, isopach methods emphasize stratigraphic thickness relevant to petroleum geology and sedimentology.
Techniques for Creating Isopach Maps
Isopach maps are created using techniques such as seismic reflection data interpretation, well log correlation, and geostatistical interpolation to measure thickness variations of stratigraphic units. Advanced GIS software integrates well log data and seismic horizons to generate continuous thickness contours that define isopach maps accurately. These methods contrast with isotherm mapping, which primarily involves temperature distribution analysis rather than lithological thickness measurement.
Isotherm vs Isopach: Practical Field Uses
Isotherms represent lines of equal temperature on a map, useful in meteorology for tracking temperature distributions and identifying thermal gradients in the atmosphere or soil. Isopachs indicate lines of equal thickness, commonly applied in geology and petroleum exploration to measure sediment or rock layer thickness variations. Both tools aid field professionals, with isotherms helping in climate analysis and isopachs facilitating reservoir characterization and stratigraphic correlation.
Interpreting Subsurface Structures: Isotherm vs Isopach
Isotherms represent lines of equal temperature within a subsurface geological formation, helping to interpret thermal gradients and heat flow variations that influence rock properties and fluid behavior. Isopachs, on the other hand, are contours of equal thickness of sedimentary or rock layers, critical for assessing depositional environments, stratigraphic traps, and reservoir extents. Comparing isotherm and isopach maps aids geoscientists in understanding temperature distribution relative to layer thickness, enhancing subsurface structural interpretation for exploration and production.
Common Misconceptions Between Isotherm and Isopach
Isotherms represent lines of equal temperature on a map, while isopachs denote lines of equal thickness within geological strata. A common misconception is confusing isotherms with isopachs due to their similar prefix "iso-," which means "equal," but they apply to different scientific measurements--temperature versus thickness. Understanding this distinction is crucial for accurate data interpretation in meteorology and stratigraphy.
Future Trends in Isotherm and Isopach Analysis
Future trends in isotherm and isopach analysis emphasize integrating advanced machine learning algorithms and high-resolution satellite imagery to enhance spatial accuracy and predictive modeling. Emerging technologies, such as 3D subsurface mapping and real-time data analytics, are expected to revolutionize the interpretation of thermal and thickness variations in geological formations. Increased adoption of automated data processing tools will facilitate faster and more detailed isotherm and isopach assessments, crucial for energy resource management and environmental monitoring.
Isotherm Infographic