Shaded relief maps enhance terrain visualization by simulating shadows cast by sunlight, revealing contours and elevation changes with greater clarity. This technique improves your ability to interpret geological features and landforms in various applications such as hiking, urban planning, and environmental studies. Explore the rest of the article to learn how shaded relief is created and applied for more effective map reading.
Table of Comparison
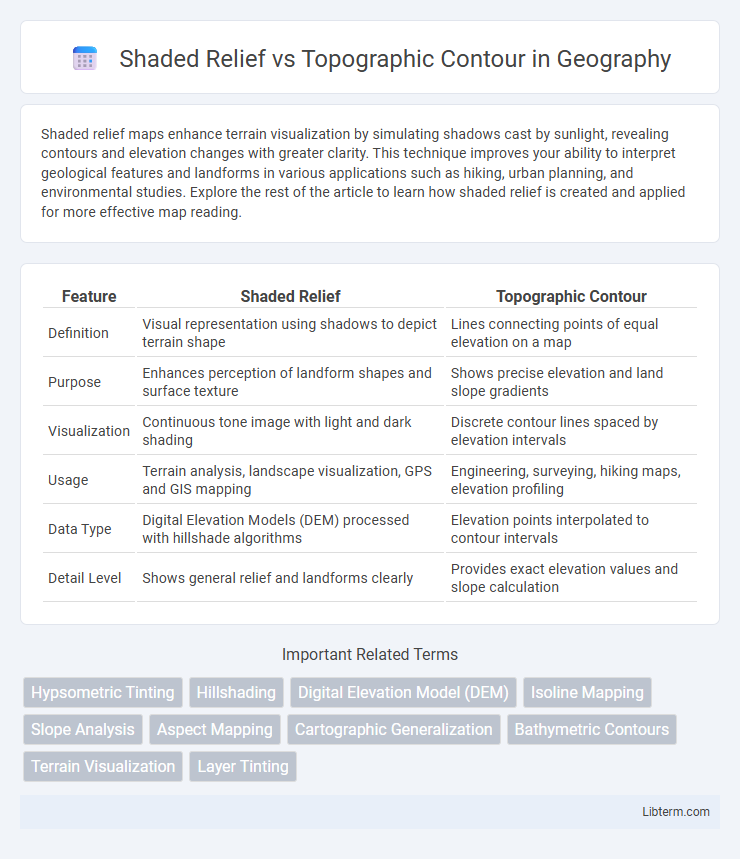
| Feature | Shaded Relief | Topographic Contour |
|---|---|---|
| Definition | Visual representation using shadows to depict terrain shape | Lines connecting points of equal elevation on a map |
| Purpose | Enhances perception of landform shapes and surface texture | Shows precise elevation and land slope gradients |
| Visualization | Continuous tone image with light and dark shading | Discrete contour lines spaced by elevation intervals |
| Usage | Terrain analysis, landscape visualization, GPS and GIS mapping | Engineering, surveying, hiking maps, elevation profiling |
| Data Type | Digital Elevation Models (DEM) processed with hillshade algorithms | Elevation points interpolated to contour intervals |
| Detail Level | Shows general relief and landforms clearly | Provides exact elevation values and slope calculation |
Introduction to Shaded Relief and Topographic Contour
Shaded relief enhances map visualization by simulating light and shadow on terrain, providing a three-dimensional effect that highlights elevation changes. Topographic contour maps use continuous lines to represent consistent elevation levels, allowing precise interpretation of landscape slopes and features. Combining shaded relief with contour lines offers a comprehensive view of terrain, improving spatial understanding and navigation accuracy.
Defining Shaded Relief Maps
Shaded relief maps visualize terrain by simulating light and shadow effects to emphasize elevation changes, enhancing the perception of landforms in three dimensions. Unlike topographic contour maps that use precise lines to indicate elevation at constant intervals, shaded relief maps provide a more intuitive and visually engaging representation of landscapes. These maps are essential for geologists, environmental planners, and outdoor enthusiasts seeking a realistic depiction of topography.
Understanding Topographic Contour Maps
Topographic contour maps use continuous lines to represent elevation changes, providing precise information about terrain shape and slope gradient. Each contour line connects points of equal elevation, enabling accurate measurement of landform steepness and elevation differences. This method enhances spatial understanding of geographic features, making it essential for activities such as hiking, surveying, and geological analysis.
Visual Differences: Shaded Relief vs Contour Lines
Shaded relief maps use gradient shading to simulate light and shadow on terrain, giving a three-dimensional appearance that highlights elevation changes and landform textures. Topographic contour maps represent terrain by drawing continuous lines that connect points of equal elevation, offering precise elevation data without visual depth. The visual difference lies in shaded relief's realistic, intuitive terrain representation versus contour lines' abstract, quantitative elevation depiction.
Interpreting Elevation and Terrain
Shaded Relief maps use light and shadow effects to visually emphasize terrain features, aiding intuitive interpretation of elevation changes and landform shapes. Topographic Contour maps represent elevation with precise contour lines, providing accurate numerical values for elevation and slope gradients. Combining both methods enhances terrain analysis by offering detailed elevation data from contours alongside realistic terrain visualization from shaded relief.
Applications in Geographic Information Systems (GIS)
Shaded relief enhances terrain visualization in GIS by simulating light and shadow effects based on elevation data, which aids in intuitive interpretation of landscape features such as ridges, valleys, and slopes. Topographic contours provide precise elevation lines that enable accurate analysis of terrain gradients, watershed delineation, and infrastructure planning within GIS platforms. Combining shaded relief with contour lines optimizes spatial analysis, supporting applications in environmental management, urban planning, and geological mapping.
Advantages of Shaded Relief Maps
Shaded relief maps provide a visually intuitive representation of terrain by simulating light and shadows, enhancing the perception of elevation and landform shapes more effectively than topographic contour lines. They allow for immediate recognition of landscape features such as ridges, valleys, and slopes, aiding in spatial analysis and decision-making for fields like geology, urban planning, and outdoor navigation. The continuous tone and realistic depth in shaded relief maps help users interpret complex topography without the need to read multiple contour intervals, improving accessibility and reducing the potential for misinterpretation.
Strengths of Topographic Contour Maps
Topographic contour maps excel in precisely depicting elevation changes and landform shapes through clearly defined contour lines, enabling accurate measurement of terrain slopes and altitudes. Their strength lies in providing detailed, quantitative elevation data essential for navigation, engineering, and geological analysis. Unlike shaded relief maps, topographic contours offer unambiguous information on vertical intervals and gradient variations, crucial for planning construction projects and environmental assessments.
Choosing the Right Map for Your Needs
Shaded relief maps provide a realistic three-dimensional view of terrain, making them ideal for visualizing elevation changes and landscape features at a glance. Topographic contour maps offer precise elevation data through contour lines, essential for activities requiring exact altitude measurements such as hiking, engineering, or land surveying. Selecting the right map depends on whether you prioritize visual terrain understanding or accurate elevation analysis for your specific needs.
Future Trends in Terrain Visualization
Shaded relief maps enhance terrain visualization by simulating light and shadow effects, providing intuitive depth perception, while topographic contour maps offer precise elevation data through detailed lines. Future trends in terrain visualization emphasize integrating 3D modeling and augmented reality to merge shaded relief realism with contour accuracy, enabling interactive and immersive geographic analysis. Advances in AI-driven terrain rendering and real-time data processing will further revolutionize how geospatial information is visualized and utilized across various industries.
Shaded Relief Infographic