Unitary elasticity occurs when the percentage change in quantity demanded equals the percentage change in price, resulting in a price elasticity of demand equal to one. This concept helps businesses understand how changes in price impact total revenue without causing disproportionate shifts in demand. Explore the rest of the article to discover how unitary elasticity affects your pricing strategies and market decisions.
Table of Comparison
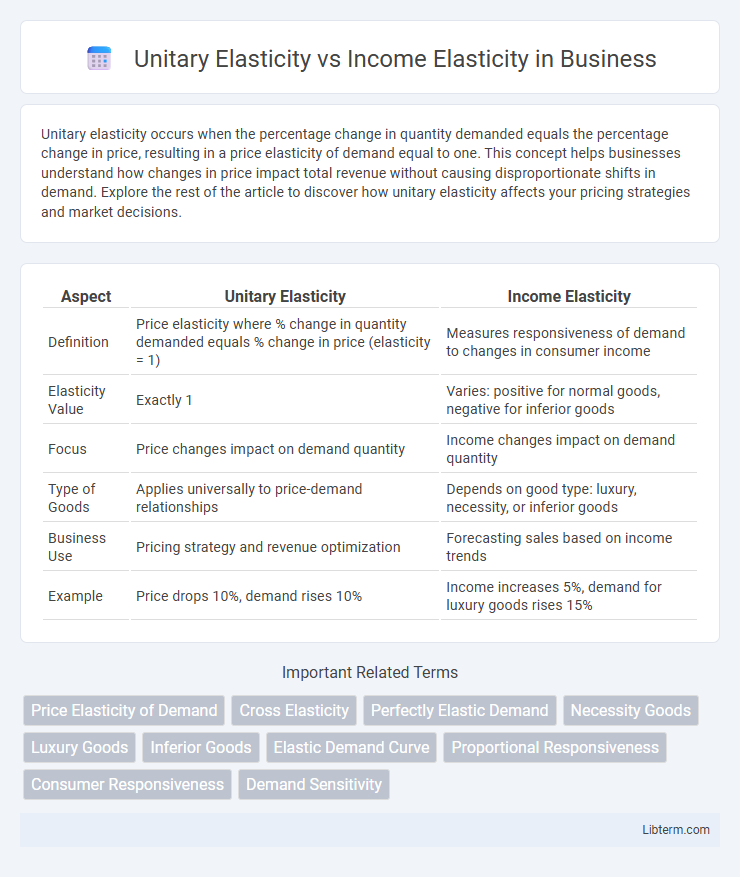
| Aspect | Unitary Elasticity | Income Elasticity |
|---|---|---|
| Definition | Price elasticity where % change in quantity demanded equals % change in price (elasticity = 1) | Measures responsiveness of demand to changes in consumer income |
| Elasticity Value | Exactly 1 | Varies: positive for normal goods, negative for inferior goods |
| Focus | Price changes impact on demand quantity | Income changes impact on demand quantity |
| Type of Goods | Applies universally to price-demand relationships | Depends on good type: luxury, necessity, or inferior goods |
| Business Use | Pricing strategy and revenue optimization | Forecasting sales based on income trends |
| Example | Price drops 10%, demand rises 10% | Income increases 5%, demand for luxury goods rises 15% |
Introduction to Elasticity in Economics
Unitary elasticity occurs when the percentage change in quantity demanded equals the percentage change in price, resulting in an elasticity coefficient of one, indicating proportional responsiveness. Income elasticity of demand measures how quantity demanded varies with consumer income changes, distinguishing between normal goods (positive elasticity) and inferior goods (negative elasticity). Both concepts are fundamental in elasticity analysis, helping economists predict consumer behavior and market dynamics under varying economic conditions.
Defining Unitary Elasticity
Unitary elasticity occurs when the percentage change in quantity demanded equals the percentage change in price, resulting in an elasticity coefficient of one. It indicates a proportional responsiveness of demand to price changes, unlike income elasticity, which measures how quantity demanded varies with consumer income changes. Understanding unitary elasticity helps businesses optimize pricing strategies by predicting balanced demand shifts.
Understanding Income Elasticity
Income elasticity of demand measures how consumer demand for a good changes in response to income variations, indicating whether a product is a necessity or a luxury. Unitary elasticity occurs when the percentage change in demand exactly matches the percentage change in income, with an income elasticity coefficient equal to one. Understanding income elasticity helps businesses and policymakers predict shifts in consumption patterns as household incomes fluctuate.
Key Differences Between Unitary and Income Elasticity
Unitary elasticity indicates a proportional change in quantity demanded relative to price, characterized by an elasticity value equal to one, whereas income elasticity measures how quantity demanded varies with consumer income changes. Unitary elasticity focuses exclusively on price sensitivity of demand, while income elasticity analyzes demand responsiveness to income levels, which can be positive or negative depending on whether goods are normal or inferior. The key distinction lies in their determinants: unitary elasticity centers on price effects, and income elasticity assesses consumer purchasing power impact.
Mathematical Formulas and Calculations
Unitary elasticity occurs when the price elasticity of demand equals one, represented by the formula |Ed| = |(dQ/dP) * (P/Q)| = 1, indicating proportional changes in quantity demanded relative to price changes. Income elasticity of demand is calculated as Ey = (dQ/dI) * (I/Q), where Ey measures the responsiveness of quantity demanded to changes in consumer income, with Ey > 1 for luxury goods and 0 < Ey < 1 for necessities. Both elasticities help quantify demand sensitivity but differ as price elasticity focuses on price-quantity relationships, while income elasticity assesses quantity changes in response to income variations.
Real-World Examples of Unitary Elasticity
Unitary elasticity occurs when the percentage change in quantity demanded equals the percentage change in price, leading to a constant total revenue, commonly observed in mid-range housing markets where price adjustments directly balance demand shifts. In contrast, income elasticity measures how demand varies with consumer income changes, seen in luxury goods like high-end electronics with positive income elasticity and staples such as bread with low or negative income elasticity. Real-world examples of unitary elasticity include gasoline sales in metropolitan areas, where price fluctuations prompt proportionate demand responses, maintaining stable revenue despite market changes.
Real-World Examples of Income Elasticity
Income elasticity of demand measures how consumer demand changes with income fluctuations, often illustrated by luxury goods like high-end electronics, where demand rises disproportionately as incomes increase. Essential items such as food or utilities typically exhibit low or inelastic income elasticity because demand remains relatively stable despite income changes. Unitary elasticity differs by showing equal proportional change in price and quantity demanded, common in products with balanced responsiveness, but it does not capture variations driven by income shifts seen in income elasticity examples.
Importance in Business and Policy Decisions
Unitary elasticity indicates proportional responsiveness of quantity demanded to price changes, crucial for businesses in pricing strategies to maintain revenue stability. Income elasticity measures demand sensitivity to consumer income variations, guiding firms and policymakers in forecasting market demand shifts during economic fluctuations. Understanding both elasticities enables targeted marketing, optimal resource allocation, and informed policy formulation to stimulate economic growth.
Impacts on Consumer Behavior and Market Demand
Unitary elasticity indicates that a percentage change in price causes an equivalent percentage change in quantity demanded, reflecting consumers' balanced sensitivity to price fluctuations, leading to stable revenue for producers. Income elasticity measures how changes in consumer income influence demand, with positive values signaling normal goods and negative values indicating inferior goods, thereby guiding businesses in targeting different income segments. Understanding the contrast between unitary price elasticity and varied income elasticity helps firms optimize pricing strategies and product offerings to respond effectively to market demand shifts driven by economic conditions.
Conclusion and Summary of Key Insights
Unitary elasticity indicates a proportional change in quantity demanded relative to price change, reflecting balanced consumer sensitivity, while income elasticity measures how demand varies with income fluctuations, revealing goods' normal or inferior status. Distinguishing between these elasticities enables precise market predictions and strategic pricing aligned with consumer income trends. Understanding their unique roles supports optimized revenue management and targeted marketing approaches.
Unitary Elasticity Infographic