A Venn diagram visually represents relationships between different sets using overlapping circles to show commonalities and differences. It helps simplify complex data, making it easier to identify intersections and unique elements within groups. Discover how Venn diagrams can clarify your data analysis by exploring the rest of this article.
Table of Comparison
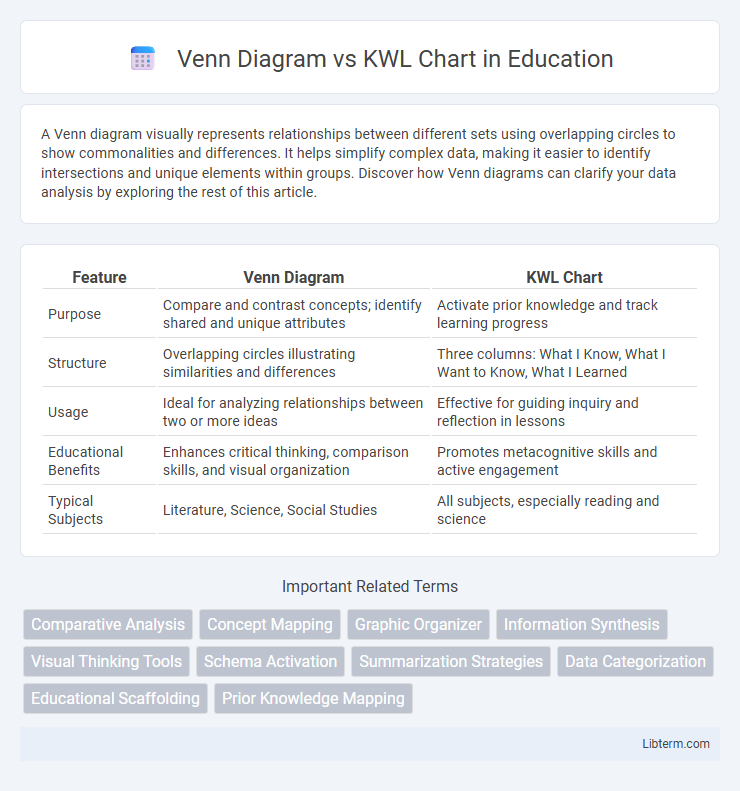
| Feature | Venn Diagram | KWL Chart |
|---|---|---|
| Purpose | Compare and contrast concepts; identify shared and unique attributes | Activate prior knowledge and track learning progress |
| Structure | Overlapping circles illustrating similarities and differences | Three columns: What I Know, What I Want to Know, What I Learned |
| Usage | Ideal for analyzing relationships between two or more ideas | Effective for guiding inquiry and reflection in lessons |
| Educational Benefits | Enhances critical thinking, comparison skills, and visual organization | Promotes metacognitive skills and active engagement |
| Typical Subjects | Literature, Science, Social Studies | All subjects, especially reading and science |
Introduction to Venn Diagrams and KWL Charts
Venn diagrams visually represent the relationships and intersections between different sets using overlapping circles, allowing for clear comparison and contrast of concepts. KWL charts organize knowledge into three columns--What I Know, What I Want to Know, and What I Learned--guiding learners through the process of inquiry and reflection. Both tools enhance comprehension by structuring information, with Venn diagrams emphasizing relational analysis and KWL charts focusing on active learning and knowledge tracking.
Defining Venn Diagrams
Venn diagrams visually represent the relationships and intersections between different sets or groups using overlapping circles, making complex data easier to analyze and compare. Each circle in a Venn diagram denotes a specific category, with shared areas illustrating common elements, which are essential in fields like mathematics, logic, and data science. Unlike KWL charts that organize prior knowledge, learning goals, and acquired information in columns, Venn diagrams focus solely on highlighting similarities and differences within and between sets.
Understanding the KWL Chart
The KWL Chart enhances comprehension by structuring learning into three phases: what learners Know, what they Want to know, and what they have Learned. This chart promotes active engagement by encouraging learners to set goals and reflect on new information, making it a dynamic tool for knowledge retention. Unlike the Venn Diagram, which primarily visualizes similarities and differences, the KWL Chart fosters critical thinking and metacognition through its interactive learning process.
Key Differences Between Venn Diagrams and KWL Charts
Venn Diagrams visually represent relationships and intersections between different sets, making them ideal for comparing and contrasting concepts. KWL Charts organize information into three columns--What I Know, What I Want to Know, and What I Learned--supporting active learning and knowledge tracking. While Venn Diagrams emphasize relational analysis, KWL Charts focus on sequential understanding and knowledge discovery.
Benefits of Using Venn Diagrams
Venn diagrams visually represent relationships and similarities between different sets, enhancing comprehension of complex concepts through clear, overlapping circles. They support critical thinking by enabling users to compare and contrast multiple categories simultaneously, making patterns and connections easier to identify. This graphical tool is particularly effective in brainstorming, problem-solving, and data analysis across various educational and professional fields.
Advantages of the KWL Chart
KWL Charts enhance active learning by helping students organize what they Know, what they Want to learn, and what they have Learned, promoting deeper engagement with the content. They are particularly effective in assessing prior knowledge and guiding inquiry-based learning, making them valuable tools in classroom settings. Unlike Venn Diagrams, KWL Charts support reflective thinking and continuous knowledge assessment throughout the learning process.
Classroom Applications for Venn Diagrams
Venn diagrams serve as powerful visual tools in the classroom, helping students compare and contrast concepts by clearly illustrating shared and unique attributes between sets. They enhance critical thinking and categorization skills across subjects like literature, science, and social studies by enabling learners to organize information logically. Teachers use Venn diagrams to promote interactive learning, facilitate group discussions, and assess students' understanding of relationships among ideas.
Effective Uses of KWL Charts in Education
KWL charts effectively enhance student comprehension by organizing prior knowledge (K), learning goals (W), and newly acquired information (L), fostering active engagement and self-assessment. These charts support differentiated instruction by guiding students through inquiry-based learning and helping educators tailor lessons based on students' understanding and questions. Unlike Venn diagrams, which highlight similarities and differences, KWL charts specifically promote metacognitive skills and track learning progression in educational settings.
Choosing the Right Tool: Venn Diagram or KWL Chart?
Choosing between a Venn Diagram and a KWL Chart depends on the learning objective and data organization needs. Venn Diagrams are ideal for comparing and contrasting concepts by visually displaying shared and unique attributes among sets, enhancing analytical thinking. KWL Charts excel in tracking knowledge acquisition by categorizing what learners Know, Want to know, and have Learned, making them effective for guiding inquiry-based learning and self-assessment.
Conclusion: Maximizing Learning with Visual Tools
Venn diagrams enhance learning by visually organizing similarities and differences between concepts, improving comparative analysis and critical thinking skills. KWL charts optimize knowledge acquisition by guiding learners through what they Know, Want to know, and have Learned, fostering active engagement and reflection. Combining these tools maximizes understanding and retention by addressing different cognitive processes through structured visual representation.
Venn Diagram Infographic