The food chain illustrates the flow of energy and nutrients through different organisms, starting with producers like plants and ending with apex predators. Understanding the roles of herbivores, carnivores, and decomposers helps reveal the complex relationships that sustain ecosystems. Discover how the food chain impacts your environment and why maintaining its balance is crucial by reading the rest of the article.
Table of Comparison
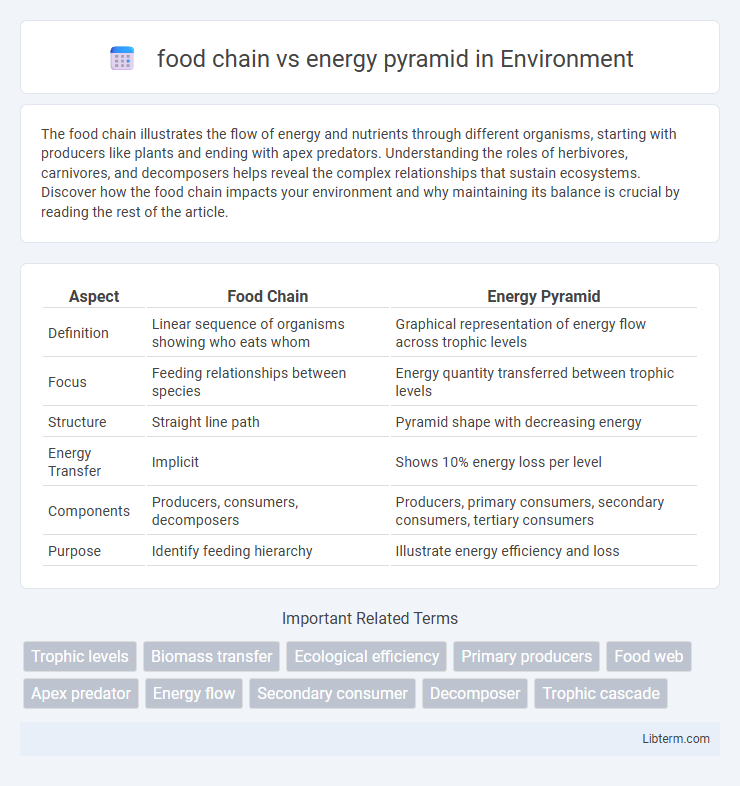
| Aspect | Food Chain | Energy Pyramid |
|---|---|---|
| Definition | Linear sequence of organisms showing who eats whom | Graphical representation of energy flow across trophic levels |
| Focus | Feeding relationships between species | Energy quantity transferred between trophic levels |
| Structure | Straight line path | Pyramid shape with decreasing energy |
| Energy Transfer | Implicit | Shows 10% energy loss per level |
| Components | Producers, consumers, decomposers | Producers, primary consumers, secondary consumers, tertiary consumers |
| Purpose | Identify feeding hierarchy | Illustrate energy efficiency and loss |
Introduction to Food Chains and Energy Pyramids
Food chains illustrate the linear flow of energy from producers to various levels of consumers within an ecosystem. Energy pyramids visually represent the decreasing energy available at each trophic level, highlighting energy loss due to metabolic processes. Understanding both concepts is essential for analyzing ecosystem dynamics and energy transfer efficiency.
Defining the Food Chain
The food chain is a linear sequence that shows the flow of energy and nutrients from one organism to another, starting with producers like plants and ending with top predators. It illustrates how each organism depends on the preceding one for energy, emphasizing feeding relationships and trophic levels. In contrast, an energy pyramid quantifies the energy transfer efficiency between trophic levels, highlighting energy loss as it moves up the chain.
Understanding the Energy Pyramid
The energy pyramid illustrates the flow of energy through trophic levels, emphasizing that energy decreases by approximately 90% with each transfer from producers to apex consumers. This loss occurs due to metabolic processes, heat dissipation, and inefficient energy transfer, highlighting the limited energy available to higher trophic levels. Understanding the energy pyramid clarifies why food chains typically have fewer top-level predators and underscores the importance of primary producers in sustaining ecosystems.
Components of a Food Chain
A food chain consists of primary components such as producers, consumers, and decomposers, which represent the flow of energy through an ecosystem. Producers, mainly plants and algae, capture solar energy through photosynthesis to create organic matter. Consumers, divided into herbivores, carnivores, and omnivores, obtain energy by feeding on producers or other consumers, while decomposers break down organic waste, recycling nutrients back into the ecosystem.
Structure of an Energy Pyramid
The structure of an energy pyramid illustrates the distribution of energy among trophic levels, with producers at the base and apex predators at the top. Each ascending level represents a decrease in available energy, typically losing about 90% due to metabolic processes and heat loss. This hierarchical format visually emphasizes the inefficiency of energy transfer within ecosystems compared to the linear sequence depicted in a food chain.
Flow of Energy in Food Chains
The flow of energy in food chains begins with primary producers, such as plants, capturing solar energy through photosynthesis and converting it into chemical energy. This energy is transferred to primary consumers (herbivores) when they consume plants, and then to secondary and tertiary consumers (carnivores) as they feed on herbivores and other carnivores. Energy decreases at each trophic level due to metabolic processes, which is visually represented in the energy pyramid where the widest base of energy is at the producer level and narrows sharply toward apex predators.
Energy Loss in Ecological Pyramids
Energy loss in ecological pyramids occurs as energy transfers between trophic levels in a food chain, with approximately 90% of energy dissipated as heat or metabolic processes at each step. This significant reduction limits energy availability for higher trophic levels, resulting in fewer organisms and reduced biomass in top predators compared to primary producers. The energy pyramid visually represents this decline, emphasizing the inefficiency of energy transfer within ecosystems.
Key Differences Between Food Chains and Energy Pyramids
Food chains illustrate the linear flow of energy and nutrients from one organism to another, typically starting with producers and ending with apex predators. Energy pyramids represent the decreasing amount of energy available at successive trophic levels, highlighting energy loss due to metabolic processes. Unlike food chains, which show feeding relationships, energy pyramids quantify energy transfer efficiency within an ecosystem.
Importance in Ecosystem Dynamics
Food chains describe the linear flow of energy and nutrients from producers to apex predators, illustrating specific feeding relationships in an ecosystem. Energy pyramids quantify this flow, highlighting energy loss at each trophic level and emphasizing the critical role of primary producers in sustaining ecosystem vitality. Understanding both concepts is essential for analyzing energy transfer efficiency and maintaining ecological balance.
Real-World Examples and Applications
A food chain in a coral reef ecosystem illustrates energy transfer from phytoplankton to herbivorous fish and then to apex predators like sharks, demonstrating trophic interactions. The energy pyramid for the African savanna highlights biomass distribution, with primary producers like grasses supporting herbivores such as zebras, which in turn sustain carnivores like lions, revealing energy loss at each trophic level. Understanding these models aids in wildlife conservation strategies and informs sustainable fisheries management by predicting population impacts and energy flow disruptions.
food chain Infographic