The Barrow Observatory CO2 record provides critical long-term data on atmospheric carbon dioxide levels, highlighting trends in greenhouse gas concentrations and their impact on global climate change. This continuous measurement helps scientists understand seasonal variations and informs predictive climate models essential for environmental policy and research. Discover how this data shapes our knowledge of climate dynamics and what it means for Your planet's future in the full article.
Table of Comparison
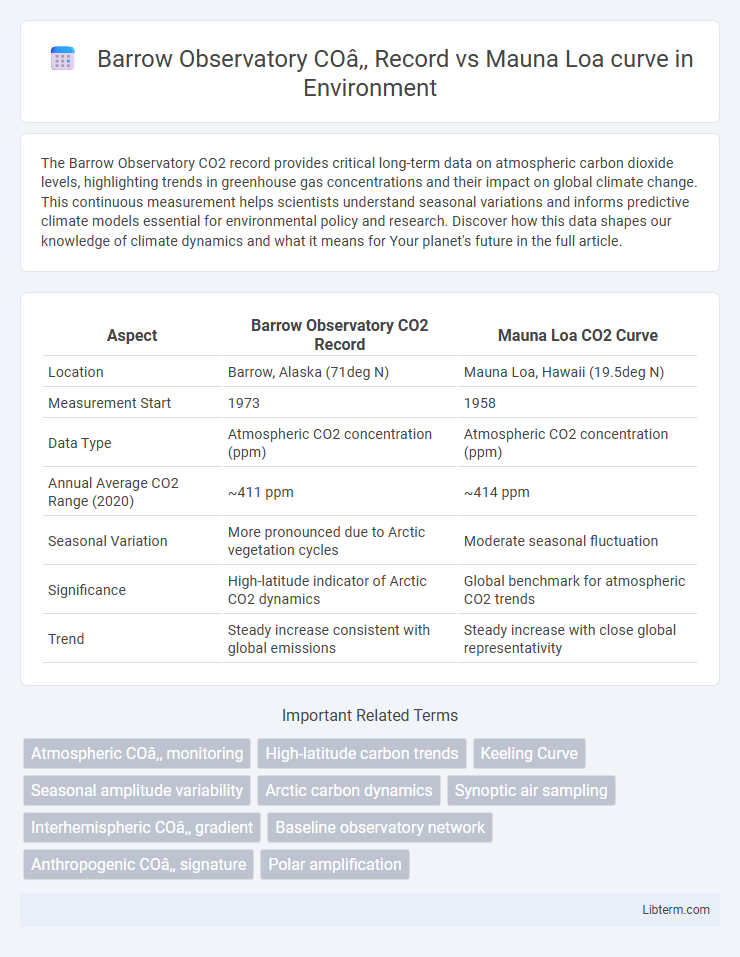
| Aspect | Barrow Observatory CO2 Record | Mauna Loa CO2 Curve |
|---|---|---|
| Location | Barrow, Alaska (71deg N) | Mauna Loa, Hawaii (19.5deg N) |
| Measurement Start | 1973 | 1958 |
| Data Type | Atmospheric CO2 concentration (ppm) | Atmospheric CO2 concentration (ppm) |
| Annual Average CO2 Range (2020) | ~411 ppm | ~414 ppm |
| Seasonal Variation | More pronounced due to Arctic vegetation cycles | Moderate seasonal fluctuation |
| Significance | High-latitude indicator of Arctic CO2 dynamics | Global benchmark for atmospheric CO2 trends |
| Trend | Steady increase consistent with global emissions | Steady increase with close global representativity |
Introduction to Atmospheric CO₂ Monitoring
Barrow Observatory in Alaska and Mauna Loa Observatory in Hawaii provide critical long-term atmospheric CO2 records that enable the analysis of global carbon cycle trends. Barrow's Arctic location captures regional variations and seasonal fluctuations, complementing Mauna Loa's stable, mid-Pacific measurements that represent a baseline for background CO2 levels. Together, these datasets enhance understanding of anthropogenic impacts and natural processes influencing atmospheric CO2 concentrations worldwide.
Overview of Barrow Observatory and Mauna Loa Observatory
Barrow Observatory, located in Alaska, provides critical atmospheric CO2 measurements that capture trends in the Arctic region, complementing the global baseline established by Mauna Loa Observatory in Hawaii. Mauna Loa Observatory, known for its continuous and precise CO2 data since 1958, serves as a benchmark for global carbon dioxide monitoring due to its remote location and minimal local pollution sources. Comparing the Barrow and Mauna Loa CO2 records reveals regional variations influenced by factors like Arctic amplification and seasonal atmospheric circulation, highlighting differences in carbon dynamics between high latitudes and the central Pacific.
Historical Context: Establishing the CO₂ Records
The Barrow Observatory CO2 record, initiated in the late 1970s at a high-latitude site in Alaska, provides critical insight into northern hemisphere atmospheric CO2 variability and complements the long-standing Mauna Loa curve established in 1958. Mauna Loa's steady, continuous measurements set a global benchmark for atmospheric CO2 trends, while Barrow's data highlight regional seasonal fluctuations linked to Arctic ecosystems. Together, these records form a comprehensive historical context for understanding global and hemispheric CO2 dynamics, essential for climate change research.
Geographic and Environmental Differences
Barrow Observatory's CO2 record displays distinct seasonal amplitude and baseline variations compared to the Mauna Loa curve due to its Arctic location and proximity to terrestrial ecosystems. The Barrow site is influenced by factors such as sea ice dynamics, tundra respiration, and regional temperature fluctuations, causing sharper seasonal CO2 swings than Mauna Loa's mid-Pacific Ocean setting. Mauna Loa's data reflect more stable oceanic mixing and less direct biospheric interference, leading to comparatively smoother CO2 trends.
Methodologies in CO₂ Data Collection
Barrow Observatory employs continuous infrared gas analyzers and flask sampling to measure atmospheric CO2, ensuring high temporal resolution and accuracy. Mauna Loa Observatory utilizes non-dispersive infrared sensors combined with rigorous calibration against standard gases, maintaining a consistent long-term record since 1958. Both observatories implement strict quality control protocols, such as baseline corrections and periodic inter-comparisons, to harmonize CO2 datasets and minimize site-specific biases.
Comparative Analysis: Barrow vs Mauna Loa CO₂ Trends
Barrow Observatory's CO2 record exhibits similar upward trends to Mauna Loa's curve, reflecting consistent global atmospheric carbon dioxide increases. Barrow shows slightly higher seasonal amplitude variations due to its Arctic location, indicating stronger biospheric carbon uptake and release cycles. Comparative analysis reveals that both datasets validate long-term anthropogenic CO2 growth, with Mauna Loa providing continuous mid-Pacific baseline data while Barrow captures northern high-latitude variability.
Seasonal and Regional Variations in CO₂ Levels
The Barrow Observatory CO2 record reveals distinct seasonal fluctuations with peak concentrations in late winter and minimum levels during late summer due to regional biospheric activity in the Arctic tundra. In contrast, the Mauna Loa curve exhibits smoother seasonal variation influenced by tropical and subtropical vegetation cycles, reflecting differences in atmospheric mixing and local CO2 sources. These seasonal and regional variations highlight the impact of latitude, vegetation dynamics, and atmospheric circulation on CO2 concentration patterns.
Scientific Implications of Divergent CO₂ Records
The Barrow Observatory CO2 record exhibits seasonal fluctuations and a slight upward trend distinct from the smoother, consistently rising Mauna Loa curve, highlighting regional influences on atmospheric carbon levels. Divergences between these records emphasize the complexity of local biospheric and oceanic CO2 exchanges, challenging simplified global carbon cycle models. Such differences underscore the necessity for integrating multiple observatory data to refine predictions of anthropogenic impact and climate feedback processes.
Impact on Climate Change Research and Modeling
The Barrow Observatory CO2 record provides critical high-latitude atmospheric data that complements the Mauna Loa curve, enhancing the spatial resolution of global carbon cycle analysis. This combined dataset improves climate change research by capturing seasonal and regional variations in CO2 concentration, leading to more accurate climate models and predictions. Integrating these records enables researchers to refine carbon source-sink dynamics and better assess anthropogenic impacts on global warming trends.
Future Perspectives in Global Carbon Monitoring
Barrow Observatory CO2 record provides critical high-latitude data complementing the Mauna Loa curve, enhancing the spatial resolution of atmospheric carbon measurements crucial for climate modeling. Integration of these datasets supports improved detection of regional emission changes and carbon cycle feedbacks, informing policy decisions for global carbon reduction. Advanced satellite observations and machine learning techniques promise to synergize with ground-based records like Barrow and Mauna Loa, driving future innovations in real-time, comprehensive global carbon monitoring systems.
Barrow Observatory CO₂ Record Infographic