Vostok Ice Core Data provides valuable records of Earth's past climate by analyzing trapped air bubbles and isotopic composition within Antarctic ice layers. This information reveals fluctuations in temperature, greenhouse gas concentrations, and atmospheric composition over hundreds of thousands of years. Discover how Vostok Ice Core Data can deepen Your understanding of climate change throughout Earth's history by reading the full article.
Table of Comparison
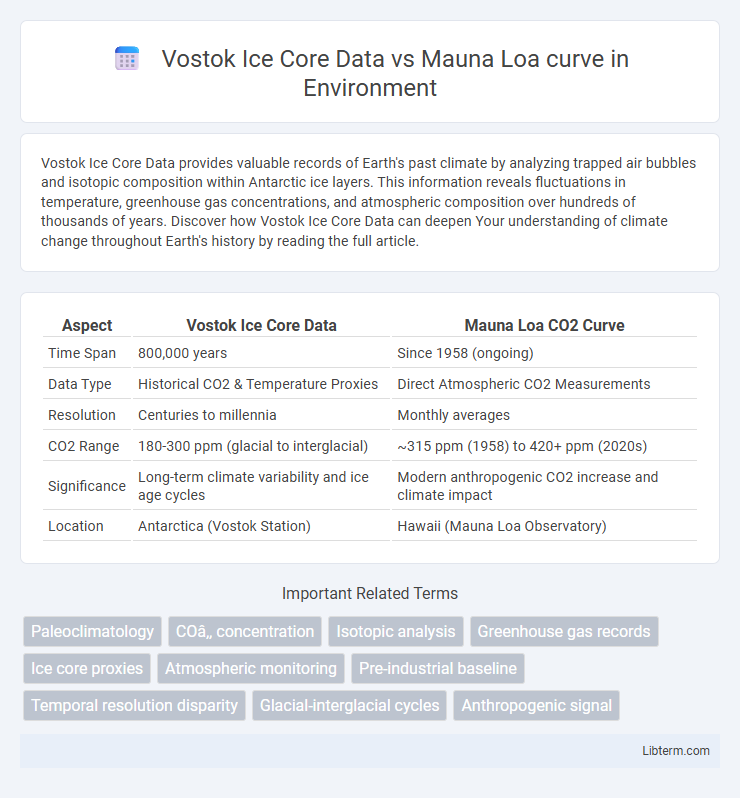
| Aspect | Vostok Ice Core Data | Mauna Loa CO2 Curve |
|---|---|---|
| Time Span | 800,000 years | Since 1958 (ongoing) |
| Data Type | Historical CO2 & Temperature Proxies | Direct Atmospheric CO2 Measurements |
| Resolution | Centuries to millennia | Monthly averages |
| CO2 Range | 180-300 ppm (glacial to interglacial) | ~315 ppm (1958) to 420+ ppm (2020s) |
| Significance | Long-term climate variability and ice age cycles | Modern anthropogenic CO2 increase and climate impact |
| Location | Antarctica (Vostok Station) | Hawaii (Mauna Loa Observatory) |
Introduction to Vostok Ice Core Data
The Vostok Ice Core Data provides a continuous climate record spanning over 400,000 years, derived from ice drilled in East Antarctica, revealing past atmospheric carbon dioxide levels and temperature fluctuations through trapped gas bubbles. This paleo-climate archive offers critical context for understanding natural climate variability, contrasting with the recent and high-resolution CO2 measurements captured by the Mauna Loa Observatory since 1958. The integration of Vostok ice core data with Mauna Loa's contemporary records highlights the unprecedented rise in atmospheric carbon dioxide linked to anthropogenic emissions.
Overview of the Mauna Loa CO₂ Curve
The Mauna Loa CO2 curve provides continuous atmospheric carbon dioxide measurements since 1958, capturing real-time increases linked to human activity, while the Vostok ice core data offers long-term CO2 concentrations from ice layers dating back over 400,000 years. Unlike the Vostok record, which reveals natural CO2 fluctuations tied to glacial cycles, the Mauna Loa curve demonstrates a rapid, unprecedented rise in CO2 levels exceeding 420 ppm as of recent years. This modern data is critical for understanding the acceleration of anthropogenic climate change in contrast to historical natural variability.
Historical Greenhouse Gas Records
Vostok ice core data reveals greenhouse gas concentrations over the past 420,000 years, showing cyclic variations closely linked to glacial and interglacial periods. The Mauna Loa curve provides precise atmospheric CO2 measurements from 1958 onwards, documenting the sharp rise due to anthropogenic emissions. Combining these datasets highlights the unprecedented recent increase in greenhouse gases compared to natural historical fluctuations.
Methods of Data Collection: Ice Cores vs Atmospheric Monitoring
Vostok Ice Core Data is obtained through deep ice drilling in Antarctica, capturing trapped air bubbles that provide historical atmospheric gas concentrations over hundreds of thousands of years. Mauna Loa curve derives from continuous atmospheric monitoring using precise infrared gas analyzers at the Mauna Loa Observatory, offering real-time measurements of current CO2 levels. The ice core method emphasizes long-term paleoclimate reconstruction, while atmospheric monitoring focuses on contemporary greenhouse gas trends with high temporal resolution.
Time Scales: Millennia vs Decades
The Vostok Ice Core Data provides a comprehensive climate record spanning hundreds of thousands of years, capturing atmospheric CO2 levels and temperature variations over millennia. In contrast, the Mauna Loa curve offers high-resolution CO2 measurements measured continuously over the past six decades, reflecting recent trends in greenhouse gas concentrations. The disparity in time scales highlights long-term natural climate cycles versus short-term anthropogenic impacts on atmospheric composition.
Comparative Analysis: CO₂ Concentration Trends
The Vostok Ice Core Data reveals CO2 concentrations over the past 420,000 years with levels fluctuating between 180 ppm during glacial periods and 280-300 ppm in interglacial phases, providing a long-term climate perspective. In contrast, the Mauna Loa CO2 curve, beginning in 1958, presents real-time atmospheric measurements showing a consistent upward trend from approximately 315 ppm to over 420 ppm, reflecting recent anthropogenic emissions. Comparing both datasets illustrates a stark departure from natural variability, highlighting unprecedented modern CO2 increases linked to industrial activity.
Climate Insights from Vostok and Mauna Loa Data
Vostok Ice Core data provide a comprehensive record of atmospheric greenhouse gases and temperature fluctuations over the past 420,000 years, revealing natural climate variability and glacial-interglacial cycles. Mauna Loa Observatory offers precise and continuous measurements of atmospheric CO2 concentrations since 1958, documenting the unprecedented rise due to anthropogenic emissions. Together, these datasets demonstrate the link between greenhouse gas levels and global temperature changes, highlighting the rapid acceleration of climate change in the industrial era.
Human Impact: Past vs Present CO₂ Levels
Vostok Ice Core data reveals natural CO2 fluctuations between 180 to 300 ppm over the past 420,000 years, closely linked to glacial and interglacial cycles. In contrast, the Mauna Loa curve shows a dramatic rise in atmospheric CO2 from about 315 ppm in 1958 to over 420 ppm today, highlighting unprecedented human impact through fossil fuel combustion and industrial activities. This sharp increase in recent decades surpasses historical natural variability, underscoring the significant role of anthropogenic emissions in current climate change trends.
Limitations and Uncertainties in Both Datasets
Vostok Ice Core Data provides long-term atmospheric CO2 records spanning over 400,000 years but faces uncertainties due to gas age-ice age differences and potential smoothing effects from gradual gas diffusion in ice. Mauna Loa curve offers high-resolution, continuous CO2 measurements since 1958, yet its limitations include regional variability and short temporal coverage. Both datasets require careful calibration and interpretation to reconcile discrepancies and understand past and present climate dynamics accurately.
Implications for Climate Change Projections
The Vostok Ice Core Data reveals historical atmospheric CO2 concentrations and temperature correlations spanning over 400,000 years, providing a deep-time perspective on climate variability. The Mauna Loa curve offers precise, real-time measurements of rising CO2 levels since 1958, highlighting the unprecedented rate of anthropogenic emissions. Comparing these datasets enhances climate change projections by validating models that integrate natural variability with recent human impacts, emphasizing the urgency of mitigation strategies to address current and future climate risks.
Vostok Ice Core Data Infographic