Isohel charts depict lines of equal sunshine duration, offering valuable insight into regional solar exposure essential for agriculture, urban planning, and renewable energy projects. Understanding how isohels vary across climates helps optimize Your strategies for maximizing sunlight utilization. Explore the rest of the article to uncover practical applications and detailed analysis of isohel maps.
Table of Comparison
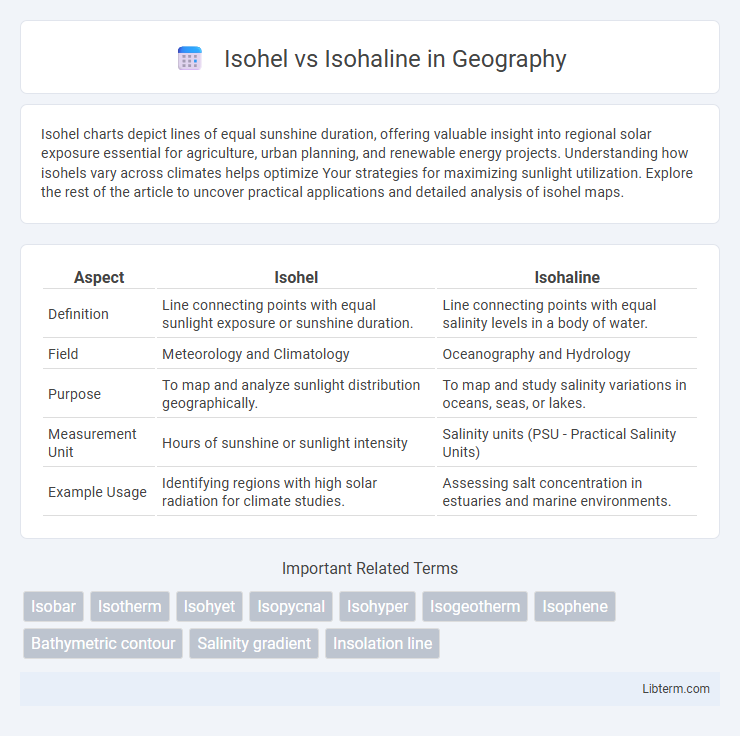
| Aspect | Isohel | Isohaline |
|---|---|---|
| Definition | Line connecting points with equal sunlight exposure or sunshine duration. | Line connecting points with equal salinity levels in a body of water. |
| Field | Meteorology and Climatology | Oceanography and Hydrology |
| Purpose | To map and analyze sunlight distribution geographically. | To map and study salinity variations in oceans, seas, or lakes. |
| Measurement Unit | Hours of sunshine or sunlight intensity | Salinity units (PSU - Practical Salinity Units) |
| Example Usage | Identifying regions with high solar radiation for climate studies. | Assessing salt concentration in estuaries and marine environments. |
Introduction to Isohel and Isohaline
Isohel and Isohaline are distinct concepts used in environmental and geographical studies to analyze different natural patterns. Isohel refers to lines on a map that connect points receiving equal sunshine duration, important for climate assessment and solar energy potential. Isohaline represents lines connecting points of equal salinity within bodies of water, crucial for understanding marine environments and water quality.
Defining Isohel: Meaning and Importance
Isohel refers to lines on a map connecting points with equal sunlight exposure, which is crucial for solar energy assessment and climate studies. Unlike isohaline lines that link points of equal salinity in water bodies, isohel maps help determine zones of consistent sunlight, impacting agriculture and urban planning. Understanding isohel patterns enables better prediction of solar radiation distribution, optimizing renewable energy deployment and environmental management.
Understanding Isohaline: Concept and Usage
Isohaline refers to lines or contours on a map that connect points with the same salinity, commonly used in oceanography to analyze salinity distribution in seawater. Understanding isohaline patterns helps researchers monitor ocean circulation, marine ecosystems, and the impact of freshwater influx on coastal environments. Isohaline data is crucial for studying salinity-driven processes such as density stratification and habitat suitability for marine species.
Key Differences Between Isohel and Isohaline
Isohel refers to contour lines on a map that connect points experiencing equal sunlight duration, used primarily in meteorology and climatology to analyze solar radiation patterns. Isohaline denotes lines joining points of equal salinity in bodies of water, crucial for understanding oceanographic and estuarine environments. The key difference lies in their domains and applications: isohel maps solar radiation intensity on land while isohaline maps salinity levels in aquatic systems.
Applications of Isohel in Meteorology
Isohel maps depict regions with equal sunshine duration, crucial for assessing solar energy potential and climate patterns in meteorology. These maps help meteorologists identify areas with high solar radiation, influencing weather forecasting and agricultural planning. Isohel data supports the optimization of solar panel placements and the study of seasonal sunlight variations.
Usage of Isohaline in Oceanography
Isohaline lines represent contours of equal salinity in oceanographic maps, essential for studying the distribution of salt levels in marine environments. Isohaline data help researchers understand ocean circulation patterns, water mass formation, and salinity-driven density gradients influencing climate systems. In contrast, isohel lines indicate equal sunlight exposure but are less relevant to salinity-focused oceanographic analyses.
Visual Representation: How Isohels and Isohalines are Drawn
Isohels are drawn by connecting points of equal solar radiation or sunlight intensity on a map, resulting in curved lines that reflect the distribution of solar energy. Isohalines, on the other hand, connect points of equal salinity in bodies of water, typically producing lines that follow ocean currents and watermass boundaries. Both visual representations use isolines but differ in data type and spatial patterns, highlighting atmospheric radiation for isohels and aquatic salinity gradients for isohalines.
Significance in Environmental Studies
Isohel maps illustrate solar radiation intensity and sunlight exposure patterns, crucial for studying microclimates and plant photosynthesis rates in environmental research. Isohaline lines represent areas of equal salinity in aquatic ecosystems, enabling the assessment of water quality, marine biodiversity, and habitat suitability. Both isohel and isohaline analyses provide essential spatial information for understanding climatic influences and ecological health in environmental studies.
Common Misconceptions: Isohel vs Isohaline
Isohel and Isohaline are often confused due to their similar prefixes, but they describe distinct phenomena in different scientific contexts. An Isohel is a line on a map representing points of equal sunlight duration, commonly used in meteorology and climatology, while an Isohaline is a contour line depicting regions of equal salinity in bodies of water, relevant to oceanography and hydrography. Misunderstanding these terms can lead to errors in environmental analysis, emphasizing the importance of distinguishing between solar radiation measurements and salinity distribution.
Conclusion: Relevance in Scientific Research
Isohel maps, illustrating lines of equal sunlight exposure, play a crucial role in climatology and solar energy studies, providing insights into solar radiation patterns. Isohaline maps, showing lines of equal salinity, are indispensable in oceanography and marine biology, helping to understand salt concentration variations impacting aquatic ecosystems. Both tools enhance scientific research by offering precise spatial data essential for environmental monitoring and resource management.
Isohel Infographic