An isopleth is a contour line on a map that connects points of equal value for a specific variable, such as temperature, precipitation, or population density. These lines help visualize spatial patterns and gradients in meteorology, geography, and environmental science. Explore the rest of the article to understand how isopleths are used in various fields and how you can interpret their significance effectively.
Table of Comparison
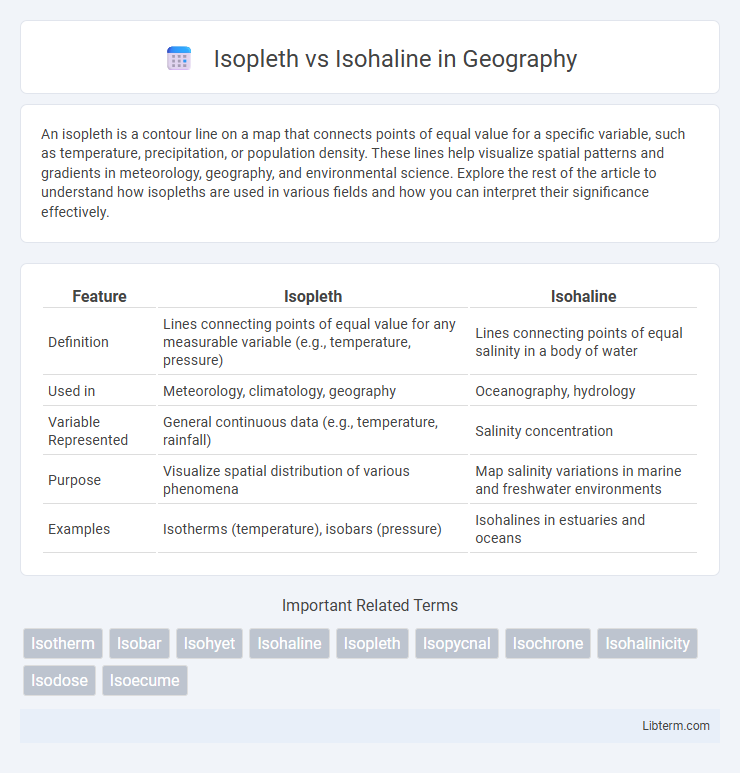
| Feature | Isopleth | Isohaline |
|---|---|---|
| Definition | Lines connecting points of equal value for any measurable variable (e.g., temperature, pressure) | Lines connecting points of equal salinity in a body of water |
| Used in | Meteorology, climatology, geography | Oceanography, hydrology |
| Variable Represented | General continuous data (e.g., temperature, rainfall) | Salinity concentration |
| Purpose | Visualize spatial distribution of various phenomena | Map salinity variations in marine and freshwater environments |
| Examples | Isotherms (temperature), isobars (pressure) | Isohalines in estuaries and oceans |
Introduction to Isopleth and Isohaline
Isopleths are contour lines on a map that connect points with equal values of a specific variable, commonly used in meteorology to represent temperature or pressure distributions. Isohalines specifically denote lines of constant salinity in marine environments, crucial for studying oceanographic processes and water mass characteristics. Both isopleths and isohalines enable clear visualization of spatial variations in environmental data, aiding scientific analysis and decision-making.
Definitions: Isopleth and Isohaline Explained
Isopleth refers to lines drawn on a map connecting points of equal value of a specific variable, commonly used in meteorology and geography to represent uniform data such as temperature or pressure. Isohaline specifically denotes contours that link points of equal salinity in bodies of water, playing a crucial role in oceanography and environmental studies. Understanding the distinction between isopleth and isohaline enables accurate interpretation of spatial data in atmospheric and aquatic research contexts.
Key Differences Between Isopleth and Isohaline
Isopleths are lines drawn on maps or charts representing equal values of a variable such as temperature, pressure, or rainfall, commonly used in meteorology and climatology. Isohalines specifically denote lines of constant salinity in bodies of water, highlighting areas with uniform salt concentration in oceanography and hydrology. The key difference lies in their application and the variable represented: isopleths cover a broad range of measurable factors across different fields, while isohalines focus exclusively on salinity levels in aquatic environments.
Origin and Etymology of the Terms
Isopleth and Isohaline derive from Greek roots, with "iso-" meaning equal or same. Isopleth combines "iso-" and "pleth," originating from "plethos," meaning quantity or value, indicating lines of equal value on maps. Isohaline merges "iso-" and "haline," from "halos," meaning salt, designating lines of equal salinity in oceanography.
Common Applications of Isopleths
Isopleths are widely used in meteorology and climatology to represent continuous data such as temperature, pressure, or humidity on weather maps, aiding in the analysis of weather patterns and forecasting. They help visualize gradients and distributions of atmospheric elements, enabling efficient decision-making in agriculture, aviation, and environmental monitoring. Isohalines, by contrast, specifically depict lines of constant salinity in oceanography, important for studying marine ecosystems and salinity-driven ocean currents.
Real-World Uses of Isohalines
Isohalines, which are lines connecting points of equal salinity in bodies of water, are crucial in oceanography and estuarine studies for monitoring salinity gradients and their impact on marine ecosystems. These lines help in understanding the distribution of freshwater and seawater mixing, aiding in managing fisheries, predicting the movement of pollutants, and assessing the effects of climate change on coastal habitats. Unlike isopleths, which represent various continuous variables, isohalines specifically provide essential data on salinity variations that influence water density and circulation patterns in aquatic environments.
Data Collection Methods for Isopleths and Isohalines
Isopleths are created by interpolating continuous data points such as temperature or elevation collected using instruments like thermometers, altimeters, or remote sensing devices across a geographic area. Isohalines are generated by measuring salinity levels directly from water samples taken at various depths and locations, often using conductivity sensors or salinometers during hydrographic surveys. Both methods rely on spatially distributed data collection followed by contour mapping techniques to visualize the gradients of the respective variables.
Visualization Techniques on Maps
Isopleths represent continuous data by connecting points of equal value, commonly used for variables like temperature or elevation, and are visualized through smooth contour lines on maps to illustrate gradients. Isohalines specifically depict lines of equal salinity in aquatic environments, employing color-coded or labeled lines to highlight salinity distribution patterns in oceans or estuaries. Both techniques enhance spatial data interpretation by providing clear visual boundaries for varying environmental parameters, facilitating analysis in meteorology, oceanography, and geographic information systems (GIS).
Importance in Environmental and Marine Sciences
Isopleths represent lines of equal value for variables like temperature or pressure, while isohalines trace areas of constant salinity in water bodies; both are crucial for mapping environmental gradients and understanding marine ecosystems. Isopleths aid in climate modeling and weather prediction by visualizing spatial variations, whereas isohalines are essential for tracking salinity changes that influence marine organism distribution and water density stratification. Monitoring isopleths and isohalines supports the assessment of environmental health, pollution dispersion, and the effects of climate change on ocean circulation patterns.
Conclusion: Isopleth vs Isohaline in Scientific Analysis
Isopleths represent lines of equal value for any continuous variable, such as temperature or pressure, across a geographic area, providing a versatile tool in scientific analysis. Isohalines specifically denote lines of constant salinity in aquatic environments, making them essential for marine and environmental studies focused on salt concentration distribution. Understanding the distinct applications of isopleths and isohalines enhances precision in data interpretation and supports targeted environmental and atmospheric research.
Isopleth Infographic