An isohyet is a line on a map that connects points of equal rainfall, helping meteorologists track precipitation patterns across a region. Understanding isohyets is crucial for managing water resources, agriculture, and predicting flood risks in your area. Explore this article to discover how isohyets impact weather analysis and environmental planning.
Table of Comparison
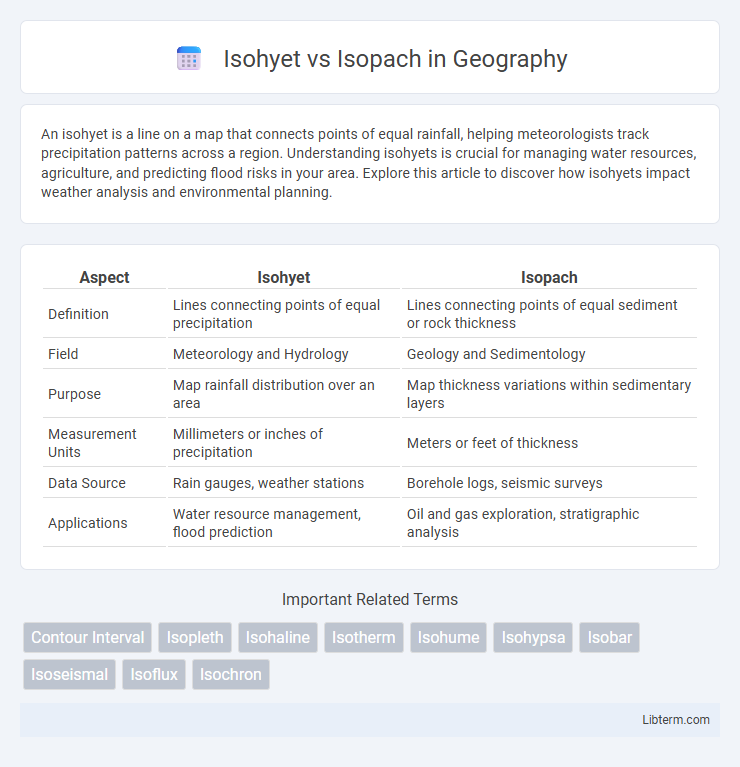
| Aspect | Isohyet | Isopach |
|---|---|---|
| Definition | Lines connecting points of equal precipitation | Lines connecting points of equal sediment or rock thickness |
| Field | Meteorology and Hydrology | Geology and Sedimentology |
| Purpose | Map rainfall distribution over an area | Map thickness variations within sedimentary layers |
| Measurement Units | Millimeters or inches of precipitation | Meters or feet of thickness |
| Data Source | Rain gauges, weather stations | Borehole logs, seismic surveys |
| Applications | Water resource management, flood prediction | Oil and gas exploration, stratigraphic analysis |
Introduction to Isohyets and Isopachs
Isohyets are contour lines on a map that connect points of equal rainfall, essential for hydrological analysis and water resource management. Isopachs represent lines of equal thickness in geological formations, commonly used in stratigraphy to visualize sedimentary layer variations. Both concepts aid in interpreting spatial distribution, but isohyets focus on precipitation patterns while isopachs emphasize geological layer thickness.
Defining Isohyet: Meaning and Applications
Isohyet represents a contour line on a map connecting points of equal precipitation or rainfall, crucial for hydrological studies and weather forecasting. It helps in analyzing spatial distribution of rainfall, assessing water resources, and planning flood control measures. Unlike isopach, which maps thickness variations in geological formations, isohyets specifically address precipitation patterns, aiding in climate research and agricultural management.
Defining Isopach: Meaning and Applications
Isopach maps represent the thickness of sedimentary rock layers or soil deposits, indicating vertical distance between two stratigraphic surfaces. These maps are crucial in geology and petroleum exploration for identifying reservoir thickness and estimating volume of underground resources. By visualizing layer variation, isopach data supports drilling decisions, resource assessment, and geological modeling.
Key Differences Between Isohyet and Isopach
Isohyets are contour lines that connect points of equal rainfall intensity or precipitation on a map, enabling the analysis of spatial rainfall distribution. Isopachs, on the other hand, represent lines of equal thickness in sedimentary layers, crucial for geological and stratigraphic assessments. The key difference lies in their application: Isohyets measure atmospheric phenomena related to precipitation, while Isopachs map geological formations related to sediment thickness.
Methods for Drawing Isohyet Maps
Drawing isohyet maps involves collecting accurate precipitation data from weather stations and employing spatial interpolation techniques such as Thiessen polygons or kriging to delineate lines of equal rainfall. In contrast, isopach maps, representing thickness variations in sedimentary layers, rely on geological field measurements, borehole data, and contouring methods to connect points of equal stratigraphic thickness. Both methods require precise data acquisition and advanced geospatial analysis tools to ensure accurate representation of hydrological or geological features.
Methods for Creating Isopach Maps
Isopach maps are created using seismic reflection data and well log measurements to illustrate variations in sediment thickness across a geological area. Techniques include digitizing time-thickness values from seismic profiles, converting these to true thickness using velocity models, and interpolating data points through geostatistical methods like kriging. Advances in 3D seismic interpretation software enhance the accuracy and resolution of isopach maps by integrating multiple data sources and applying spatial algorithms.
Importance in Meteorology and Geology
Isohyets are crucial in meteorology for mapping precipitation distribution, enabling accurate rainfall analysis and flood forecasting. Isopachs play a vital role in geology by illustrating sediment thickness variations, essential for reservoir characterization and stratigraphic studies. Both tools enhance spatial data interpretation, supporting effective environmental and resource management decisions.
Practical Uses of Isohyet and Isopach Maps
Isohyet maps are essential for rainfall distribution analysis, guiding agricultural planning, water resource management, and flood risk assessment by illustrating areas of equal precipitation. Isopach maps provide valuable insight into the thickness variations of geological layers, aiding in hydrocarbon exploration, groundwater studies, and stratigraphic correlation. Combining isohyets and isopachs enhances environmental monitoring and land use planning by aligning precipitation patterns with subsurface geological characteristics.
Common Misconceptions and Errors
Isohyet maps represent lines of equal rainfall, while isopach maps show lines of equal thickness of geological or sedimentary layers; confusing these leads to misinterpretation of hydrological data and stratigraphic information. A common error is assuming isohyets indicate sediment thickness, resulting in inaccurate environmental assessments and resource estimations. Correct identification of isohyets and isopachs is critical for precise rainfall distribution modeling and geological analysis.
Summary: Isohyet vs Isopach Comparison
Isohyet lines represent equal precipitation amounts over a geographic area, crucial for hydrological studies and rainfall distribution analysis. Isopach contours indicate equal thickness of sediment or rock layers, vital in geological and stratigraphic mapping for resource exploration. Understanding Isohyet vs Isopach differences enhances interpretation of climatic data versus subsurface geological formations.
Isohyet Infographic