A toss-up state refers to a highly competitive electoral region where no single political party holds a clear advantage, making election outcomes unpredictable. Campaign efforts in these states intensify as candidates strive to sway undecided voters, often determining the overall result of national elections. Discover how toss-up states impact your voting power and election strategies in the rest of this article.
Table of Comparison
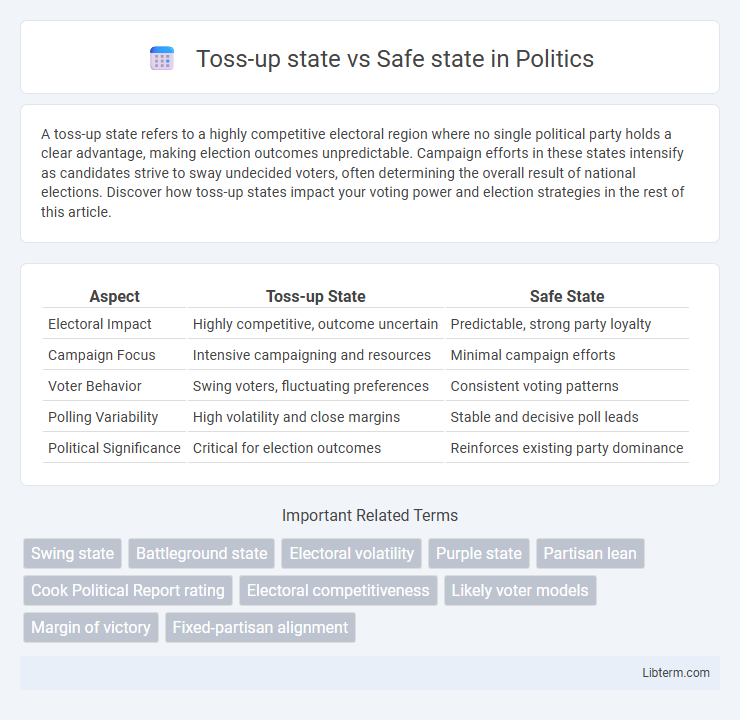
| Aspect | Toss-up State | Safe State |
|---|---|---|
| Electoral Impact | Highly competitive, outcome uncertain | Predictable, strong party loyalty |
| Campaign Focus | Intensive campaigning and resources | Minimal campaign efforts |
| Voter Behavior | Swing voters, fluctuating preferences | Consistent voting patterns |
| Polling Variability | High volatility and close margins | Stable and decisive poll leads |
| Political Significance | Critical for election outcomes | Reinforces existing party dominance |
Understanding Toss-up States vs Safe States
Toss-up states are electoral regions where voter preferences are closely divided, resulting in highly competitive and unpredictable election outcomes. Safe states consistently favor a particular political party, making election results in those areas more predictable and less contested. Understanding the distinction between toss-up states and safe states is crucial for campaign strategies, as resources and efforts are concentrated on swing areas to maximize electoral gains.
Defining Political Toss-up States
Political toss-up states are electoral regions characterized by highly competitive races with no clear dominant party, often due to nearly equal voter support for major parties. These states receive intensified campaign focus because their unpredictable outcomes can decisively influence overall election results. Identifying toss-up states involves analyzing polling data, historical voting patterns, and demographic shifts to assess the volatility and competitiveness of the electorate.
Characteristics of Safe States
Safe states exhibit consistent voting patterns favoring a particular political party, often with margins exceeding 10 percentage points in recent elections. Demographic stability, strong party loyalty, and established political infrastructure contribute to their predictability. These states attract less campaign attention as their outcomes are considered nearly guaranteed.
Historical Examples of Toss-up States
Toss-up states, such as Florida in 2000 and Ohio in 2004, have historically played pivotal roles in determining U.S. presidential election outcomes due to their evenly divided voter bases. These battleground states exhibit volatile voting patterns influenced by demographic changes, economic conditions, and campaign strategies, contrasting sharply with safe states like California or Texas that consistently favor one party. The unpredictability of toss-up states demands significant candidate attention and funding, underscoring their critical importance in the electoral college system.
Electoral Impact: Why Toss-up States Matter
Toss-up states hold significant electoral impact because they possess a nearly equal number of voters split between major parties, making them decisive in determining the election outcome. Their high voter volatility attracts substantial campaign resources and media attention, influencing national strategies and voter turnout. Safe states, where one party dominates, contribute predictable electoral votes but rarely shift the overall balance, underscoring why toss-up states are critical battlegrounds.
Demographic Factors Influencing State Status
Demographic factors such as age distribution, racial and ethnic composition, income levels, and urbanization significantly influence whether a state is categorized as toss-up or safe in elections. States with diverse populations and balanced urban-rural splits tend to be toss-up due to varying political preferences, while states with more homogeneous demographics often lean safely toward one party. Migration trends and educational attainment also reshape voter behavior, thereby affecting the stability of a state's political alignment.
Campaign Strategies in Toss-up vs Safe States
Campaign strategies in toss-up states prioritize targeted voter outreach, frequent advertising, and intensive ground operations to sway undecided or swing voters. In safe states, campaigns allocate fewer resources, focusing mainly on mobilizing the base and securing voter turnout through localized events and digital engagement. Data analytics and polling guide resource distribution, ensuring campaigns maximize influence where electoral outcomes remain uncertain.
How Toss-up States Shift Over Time
Toss-up states fluctuate due to demographic changes, shifting voter preferences, and economic factors, making them unpredictable in elections. These states often transition between parties as candidates adjust campaign strategies to address evolving local concerns. Historical trends show that migration patterns and policy impacts heavily influence whether a state remains toss-up or becomes safe for a particular party.
Voter Behavior in Safe States
Voter behavior in safe states often reveals lower turnout rates compared to toss-up states due to perceived election predictability and reduced competition. Residents in safe states tend to demonstrate partisan loyalty and engage less in campaign activities, affecting overall political mobilization. This dynamic underscores the importance of strategic resource allocation by political campaigns targeting swing regions to maximize voter influence.
The Role of Media in Shaping State Perceptions
The role of media in shaping perceptions of toss-up states versus safe states significantly influences voter behavior and campaign strategies. Media coverage tends to intensify in toss-up states, highlighting their unpredictability and amplifying political narratives, while safe states receive less focused attention, reinforcing existing partisan loyalties. This differential media emphasis impacts voter engagement, fundraising efforts, and candidate visits, ultimately shaping electoral outcomes.
Toss-up state Infographic