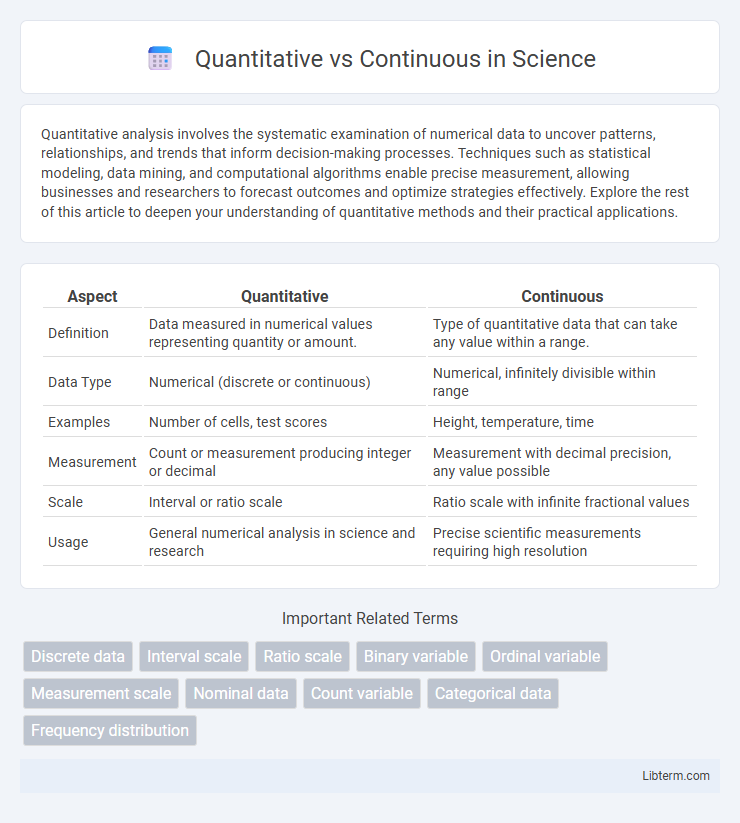
Quantitative analysis involves the systematic examination of numerical data to uncover patterns, relationships, and trends that inform decision-making processes. Techniques such as statistical modeling, data mining, and computational algorithms enable precise measurement, allowing businesses and researchers to forecast outcomes and optimize strategies effectively. Explore the rest of this article to deepen your understanding of quantitative methods and their practical applications.
Table of Comparison
| Aspect | Quantitative | Continuous |
|---|---|---|
| Definition | Data measured in numerical values representing quantity or amount. | Type of quantitative data that can take any value within a range. |
| Data Type | Numerical (discrete or continuous) | Numerical, infinitely divisible within range |
| Examples | Number of cells, test scores | Height, temperature, time |
| Measurement | Count or measurement producing integer or decimal | Measurement with decimal precision, any value possible |
| Scale | Interval or ratio scale | Ratio scale with infinite fractional values |
| Usage | General numerical analysis in science and research | Precise scientific measurements requiring high resolution |
Introduction to Quantitative and Continuous Data
Quantitative data represents measurable quantities expressed in numerical form, often categorized as discrete or continuous variables. Continuous data can take any value within a range, such as height, time, or temperature, allowing for infinite possibilities and precise measurements. Understanding the distinction between discrete quantitative data and continuous data is essential for accurate data analysis and interpretation in statistics.
Defining Quantitative Data
Quantitative data refers to information that can be measured and expressed numerically, allowing for statistical analysis and precise comparisons. It encompasses both discrete variables, which take on specific values like counts, and continuous variables, which represent measurements on a continuous scale, such as height or temperature. Defining quantitative data involves recognizing its ability to quantify attributes using units of measurement, enabling objective evaluation and mathematical computations.
Understanding Continuous Data
Continuous data represents measurements that can take any value within a range, such as height, temperature, or time, providing detailed and precise information for analysis. Unlike quantitative data, which includes discrete values like counts or categories, continuous data allows for infinite subdivisions, enabling more nuanced statistical techniques such as regression or distribution analysis. Understanding continuous data involves recognizing its potential for variability and precision, essential for applications in fields like engineering, economics, and natural sciences.
Quantitative vs Continuous: Key Differences
Quantitative data refers to numerical values that quantify characteristics, typically measured in discrete units or counts, whereas continuous data represents measurements that can take any value within a given range, including fractions and decimals. The key difference lies in their nature: quantitative data can be both discrete or continuous, but continuous data specifically involves infinitely divisible values along a continuum. Understanding these distinctions is crucial for selecting appropriate statistical analysis methods and ensuring accurate data interpretation.
Examples of Quantitative Data
Quantitative data includes measurable quantities expressed numerically, such as the number of employees in a company, monthly sales figures, or test scores. Continuous quantitative data examples involve values that can be infinitely subdivided, like height measured in centimeters or time recorded in seconds. Discrete quantitative data examples include the count of cars in a parking lot or the number of books on a shelf.
Examples of Continuous Data
Continuous data represents measurements that can take any value within a range, such as height, weight, temperature, and time. Examples of continuous data include the temperature of a city throughout the day measured in degrees Celsius, the amount of rainfall in millimeters recorded monthly, and the time taken by runners to complete a marathon recorded in hours and minutes. These values are infinitely divisible and can be expressed with decimal points, contrasting with quantitative discrete data like the number of students in a class.
Applications in Research and Analysis
Quantitative data, characterized by discrete numerical values, is essential in research fields like survey analysis and experimental studies where statistical methods quantify patterns and test hypotheses. Continuous data, which can take any value within a range, is critical in domains such as physics, engineering, and environmental science for precise measurements and dynamic modeling. Applying the correct data type enhances the accuracy of statistical analyses, regression models, and machine learning algorithms by aligning data structure with research objectives.
Advantages and Limitations
Quantitative data offers precise numerical measurement, enabling statistical analysis and clear comparisons, but it may oversimplify complex phenomena by disregarding context and nuance. Continuous data allows for infinite values within a range, providing detailed sensitivity and accuracy in capturing variations, though it can be challenging to manage due to potential measurement errors and the need for advanced analytical methods. Both data types support robust quantitative research but require careful consideration of their inherent trade-offs to ensure valid and meaningful results.
Common Misconceptions
Quantitative data is commonly misunderstood as always being continuous, but it actually encompasses both discrete and continuous variables, with discrete data representing countable values and continuous data representing measurable quantities that can take any value within a range. A frequent misconception is treating ordinal data as quantitative, when it merely denotes order without consistent intervals, leading to incorrect statistical analysis. Clarifying these distinctions is critical for choosing appropriate analytical methods and interpreting results accurately.
Choosing the Right Data Type
Choosing the right data type is essential for accurate data analysis, with quantitative data representing countable variables often expressed as integers, and continuous data reflecting measurable quantities that can take any value within a range. Quantitative data suits discrete variables like the number of sales or survey responses, while continuous data applies to measurements such as height, weight, or temperature. Properly distinguishing between these types ensures precise statistical modeling and meaningful insights in data-driven decision-making.
Quantitative Infographic

 libterm.com