Exponential growth describes a process where quantities increase rapidly at a consistent rate, leading to dramatic changes over time. Understanding exponential patterns is crucial for fields such as finance, biology, and technology, as it helps predict future trends and outcomes. Explore the rest of this article to discover how exponential growth impacts your world.
Table of Comparison
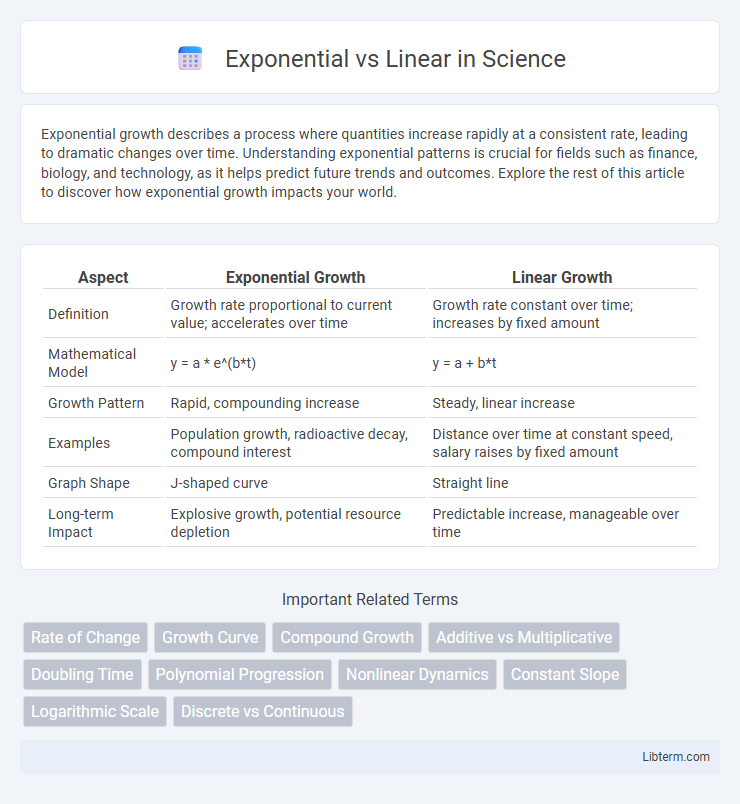
| Aspect | Exponential Growth | Linear Growth |
|---|---|---|
| Definition | Growth rate proportional to current value; accelerates over time | Growth rate constant over time; increases by fixed amount |
| Mathematical Model | y = a * e^(b*t) | y = a + b*t |
| Growth Pattern | Rapid, compounding increase | Steady, linear increase |
| Examples | Population growth, radioactive decay, compound interest | Distance over time at constant speed, salary raises by fixed amount |
| Graph Shape | J-shaped curve | Straight line |
| Long-term Impact | Explosive growth, potential resource depletion | Predictable increase, manageable over time |
Understanding Exponential and Linear Growth
Exponential growth occurs when a quantity increases by a consistent percentage over equal time intervals, resulting in rapid acceleration, while linear growth increases by a fixed amount per time period, maintaining a constant rate. Understanding the mathematical differences involves recognizing that exponential functions follow the form f(t) = a * b^t, where b > 1, and linear functions follow f(t) = mt + c, with m representing a constant slope. Applications of these models span finance, population studies, and technology adoption, where exponential growth can lead to doubling effects, contrasting with steady increments seen in linear growth.
Key Differences Between Exponential and Linear Models
Exponential models exhibit growth or decay at rates proportional to their current value, resulting in rapid increases or decreases over time, while linear models change at a constant rate, producing straight-line graphs. The key difference lies in the nature of their growth: exponential models are characterized by multiplicative change often represented by y = a * b^x, whereas linear models follow additive changes described by y = mx + c. Exponential growth is prevalent in fields such as population dynamics and compound interest, whereas linear models are commonly applied in situations with steady, uniform change like distance over time or budget forecasting.
Mathematical Representation of Exponential vs Linear Functions
Exponential functions are mathematically represented as \( f(x) = a \cdot b^x \), where \(a\) is the initial value and \(b\) is the base raised to the power of \(x\), indicating rapid growth or decay. Linear functions follow the form \( f(x) = mx + c \), where \(m\) represents the constant rate of change and \(c\) is the y-intercept, depicting steady, proportional growth. The key difference lies in the variable's position as an exponent in exponential functions, leading to multiplicative change, versus the variable being multiplied by a constant in linear functions, results in additive change.
Real-World Examples of Exponential Growth
Exponential growth occurs when a quantity increases by a consistent percentage over equal time intervals, exemplified by viral video views that can double daily, rapidly outperforming linear growth which adds a fixed amount over time, like a salary increase of $500 per month. Real-world cases include population growth where the number of individuals multiplies as more offspring reproduce, and compound interest in finance where investments grow exponentially due to interest calculated on both principal and accumulated interest. Understanding these differences highlights why phenomena like epidemics or technology adoption can escalate quickly compared to steady, linear trends.
Real-World Applications of Linear Growth
Linear growth is commonly observed in real-world applications such as salary increments, where earnings increase by a fixed amount annually, and in manufacturing processes with steady production rates over time. This type of growth enables predictable and straightforward forecasting, making it ideal for budgeting and resource allocation in business operations. Unlike exponential growth, which accelerates rapidly, linear growth maintains a constant rate, providing stability and simplicity in modeling economic trends and population increases in controlled environments.
Visualizing Data: Exponential vs Linear Graphs
Exponential graphs display rapid growth where values increase by a consistent multiplicative rate, resulting in a curve that becomes steeper over time, while linear graphs show constant growth with a straight line reflecting uniform increments. Visualizing these differences highlights how exponential data accelerates, often crossing and surpassing linear trends on the graph. Understanding these distinctive graph shapes is crucial for accurate data interpretation in fields like finance, population studies, and technology adoption.
Impact on Predictions and Forecasting
Exponential growth models capture rapid, accelerating changes in data, making them crucial for predicting phenomena like population growth, viral spread, and compound interest, where increases multiply over time. Linear models assume constant rates of change, providing simpler, steady forecasts ideal for trends with uniform growth or decline. Choosing between exponential and linear models significantly impacts the accuracy of predictions and forecasting, especially in dynamic systems where early underestimation can lead to substantial errors in long-term projections.
Common Misconceptions About Growth Patterns
Many people mistakenly believe linear growth always outpaces exponential growth in the short term, not recognizing that exponential growth accelerates rapidly after an initial slow phase. Another misconception is that exponential growth continues indefinitely, whereas in reality, it often slows due to limiting factors like resource depletion or market saturation. Understanding these nuances is crucial for accurately modeling phenomena such as population dynamics, financial investments, or technological adoption.
Choosing the Right Model for Your Data
Choosing the right model for your data hinges on understanding growth patterns: exponential models suit datasets exhibiting rapid, multiplicative increases, such as viral marketing metrics or compound interest calculations. Linear models apply best when data changes at a constant rate, like steady sales growth or fixed-rate depreciation. Accurate model selection improves predictive accuracy and informs strategic decision-making across finance, marketing, and resource management.
The Significance of Growth Patterns in Decision Making
Exponential growth, characterized by its rapid acceleration due to constant percentage increases, significantly impacts long-term decision-making by highlighting potential scalability and risks far beyond linear trajectories. In contrast, linear growth, with its steady, additive increments, offers predictability and stability that are crucial in budgeting and resource allocation. Understanding these growth patterns enables businesses and investors to tailor strategies, optimize resource deployment, and anticipate market dynamics more effectively.
Exponential Infographic