Pythagorean expectation is a statistical formula used in sports analytics to estimate a team's expected winning percentage based on the number of points scored and allowed. This method helps gauge whether a team's actual performance aligns with their underlying ability or if luck played a significant role. Explore this article to understand how applying Pythagorean expectation can enhance your insight into team performance and future outcomes.
Table of Comparison
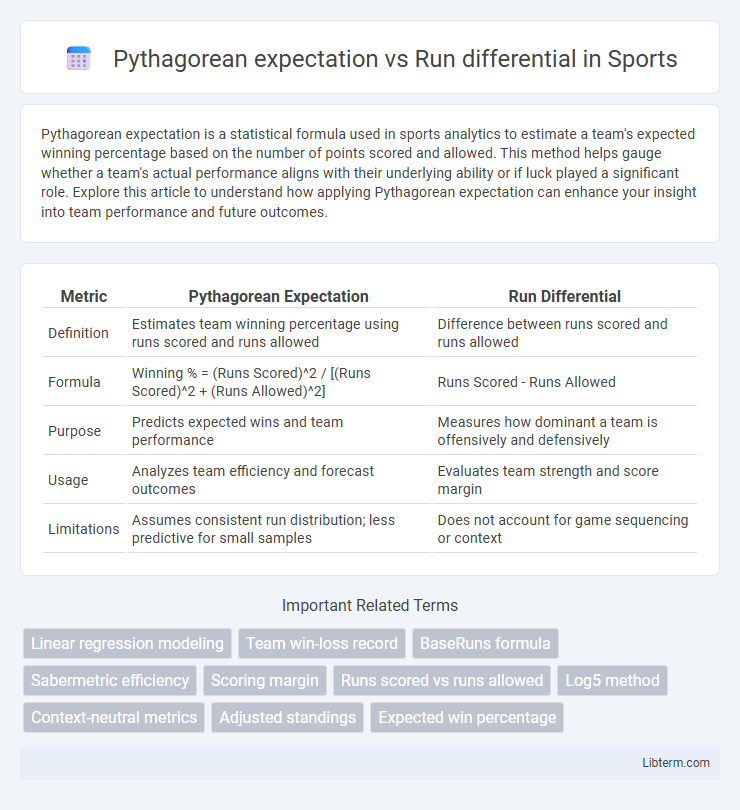
| Metric | Pythagorean Expectation | Run Differential |
|---|---|---|
| Definition | Estimates team winning percentage using runs scored and runs allowed | Difference between runs scored and runs allowed |
| Formula | Winning % = (Runs Scored)^2 / [(Runs Scored)^2 + (Runs Allowed)^2] | Runs Scored - Runs Allowed |
| Purpose | Predicts expected wins and team performance | Measures how dominant a team is offensively and defensively |
| Usage | Analyzes team efficiency and forecast outcomes | Evaluates team strength and score margin |
| Limitations | Assumes consistent run distribution; less predictive for small samples | Does not account for game sequencing or context |
Introduction to Pythagorean Expectation
Pythagorean Expectation estimates a baseball team's winning percentage based on runs scored and runs allowed, using the formula: Wins% (Runs Scored^2) / (Runs Scored^2 + Runs Allowed^2). This metric provides a more accurate reflection of team performance than simple win-loss records by correlating run differential with expected outcomes. Developed by Bill James, Pythagorean Expectation helps in predicting future wins and evaluating team efficiency beyond surface statistics.
Defining Run Differential in Baseball
Run differential in baseball measures the difference between runs scored and runs allowed by a team, serving as a key indicator of overall team strength. Unlike the Pythagorean expectation, which estimates winning percentage from runs scored and allowed using a specific formula, run differential directly reflects a team's offensive and defensive performance. A positive run differential typically correlates with a winning record, making it a crucial metric in predicting future success.
Historical Origins of Pythagorean Expectation
The Pythagorean expectation, first developed by baseball statistician Bill James in the late 1970s, provides an estimate of a team's winning percentage based on runs scored and runs allowed, derived using a formula inspired by the Pythagorean theorem. This method emerged as a response to the limitations of simple run differential, offering a more accurate prediction by weighting runs in a nonlinear fashion. Early adoption by sabermetric scholars demonstrated its effectiveness in measuring team performance beyond traditional statistics.
How Run Differential Predicts Team Success
Run differential serves as a direct indicator of a team's overall performance by measuring the difference between runs scored and runs allowed, strongly correlating with winning percentage. Unlike the Pythagorean expectation, which estimates winning percentage based on runs scored and allowed using a formula, run differential provides a straightforward metric that often aligns closely with actual team success. Statistical analyses reveal that teams with high positive run differentials consistently achieve better winning records and playoff qualifications, making run differential a reliable predictor of team success.
Mathematical Formula: Pythagorean Expectation Explained
Pythagorean Expectation estimates a baseball team's winning percentage using the formula W% = R2 / (R2 + RA2), where R represents runs scored and RA denotes runs allowed, both squared to emphasize the impact of scoring margins. This formula, derived by Bill James, correlates closely with run differential but provides a normalized winning percentage rather than a raw score difference. The exponent 2 can be adjusted for sport-specific accuracy, enhancing predictive power compared to simple run differential metrics.
Comparative Accuracy: Pythagorean vs Run Differential
Pythagorean expectation typically provides a more accurate prediction of a baseball team's winning percentage by using the formula based on runs scored and runs allowed, capturing the nonlinear relationship between scoring and winning outcomes. Run differential, which is simply the difference between runs scored and runs allowed, offers a straightforward metric but can be less precise as it assumes a linear relationship and does not account for game-to-game variability. Studies show Pythagorean expectation has higher predictive power and better correlates with actual winning percentages over a full season compared to raw run differential.
Real-World Application in Baseball Analytics
Pythagorean expectation uses runs scored and runs allowed to estimate a team's winning percentage, providing a statistically grounded prediction of future performance based on run differential. In baseball analytics, this metric helps identify overperforming or underperforming teams by comparing expected wins to actual wins, offering insights into luck and skill factors. Teams and analysts leverage Pythagorean expectation to inform strategic decisions, such as player evaluation and game strategy adjustments, optimizing competitive advantage.
Case Studies: Teams Outperforming Expectations
Teams like the 2015 Houston Astros demonstrated the limitations of Pythagorean expectation by outperforming their projected win totals based on run differential, highlighting factors such as clutch hitting and bullpen efficiency. The 2003 Atlanta Braves also showcased how strategic in-game decisions and late-inning performances can lead to sustained success beyond what run differential alone predicts. These case studies reveal that while run differential remains a strong predictor of team success, contextual game factors often drive deviations that Pythagorean expectation fails to capture fully.
Limitations and Criticisms of Each Metric
The Pythagorean expectation often oversimplifies by assuming a constant exponent, which may not accurately reflect team performance in all contexts, leading to potential misestimations of winning percentages. Run differential, while straightforward, does not account for situational factors such as clutch hitting or bullpen strength, causing discrepancies in its predictive power. Both metrics may fail to capture the full complexity of game dynamics, limiting their effectiveness as standalone evaluative tools.
Choosing the Right Metric for Team Evaluation
Pythagorean expectation provides a statistically grounded estimate of a baseball team's winning percentage based on runs scored and allowed, offering a more predictive insight than simple run differential. While run differential measures overall team performance by the net runs, it lacks the nuanced predictive power that the Pythagorean formula applies by modeling expected wins. Choosing the right metric depends on whether the focus is on historical performance analysis or forecasting future results, with Pythagorean expectation generally preferred for its accuracy in estimating winning probabilities.
Pythagorean expectation Infographic