Economic Value Added (EVA) measures a company's financial performance by calculating the value created beyond the required return of its shareholders. This metric helps assess whether a business generates true economic profit, guiding better investment and management decisions. Discover how EVA can transform your financial analysis and strategic planning in the full article.
Table of Comparison
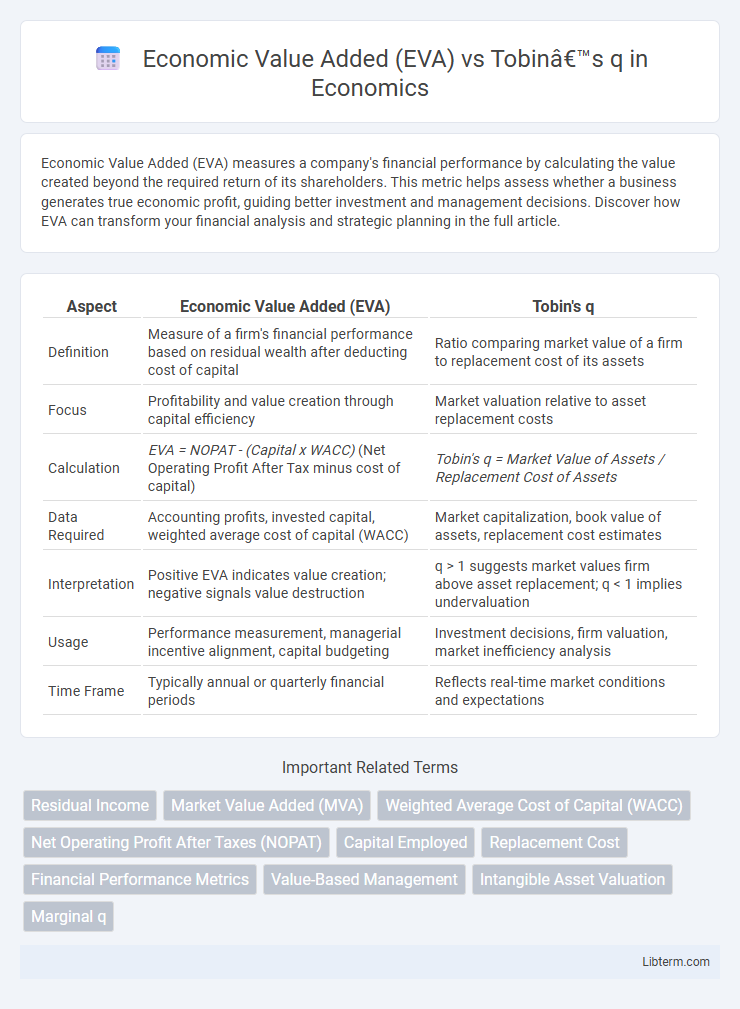
| Aspect | Economic Value Added (EVA) | Tobin's q |
|---|---|---|
| Definition | Measure of a firm's financial performance based on residual wealth after deducting cost of capital | Ratio comparing market value of a firm to replacement cost of its assets |
| Focus | Profitability and value creation through capital efficiency | Market valuation relative to asset replacement costs |
| Calculation | EVA = NOPAT - (Capital x WACC) (Net Operating Profit After Tax minus cost of capital) | Tobin's q = Market Value of Assets / Replacement Cost of Assets |
| Data Required | Accounting profits, invested capital, weighted average cost of capital (WACC) | Market capitalization, book value of assets, replacement cost estimates |
| Interpretation | Positive EVA indicates value creation; negative signals value destruction | q > 1 suggests market values firm above asset replacement; q < 1 implies undervaluation |
| Usage | Performance measurement, managerial incentive alignment, capital budgeting | Investment decisions, firm valuation, market inefficiency analysis |
| Time Frame | Typically annual or quarterly financial periods | Reflects real-time market conditions and expectations |
Introduction to Economic Value Added (EVA)
Economic Value Added (EVA) measures a company's financial performance by calculating the value created beyond the required return of its shareholders, emphasizing net operating profit after taxes minus the cost of capital. EVA highlights value creation through efficient resource management and capital utilization. Unlike Tobin's q, which compares market value to asset replacement cost, EVA provides a direct insight into operational profitability and economic profit generation.
Understanding Tobin’s q: Definition and Components
Tobin's q measures the market value of a company relative to the replacement cost of its assets, calculated as the ratio of market value of assets to their replacement cost. Key components include the market value of equity and debt, alongside the replacement cost of physical and intangible assets. This ratio helps assess whether a firm is overvalued or undervalued, serving as an indicator of investment efficiency and growth potential.
Theoretical Foundations of EVA and Tobin’s q
Economic Value Added (EVA) is grounded in residual income theory, measuring a firm's net operating profit after taxes minus the cost of capital, reflecting value creation beyond investor expectations. Tobin's q theory, derived from James Tobin's work, compares a firm's market value to the replacement cost of its assets, indicating growth opportunities and investment efficiency. EVA emphasizes cash flow-based value addition, while Tobin's q focuses on market valuation relative to asset replacement.
Calculation Methods: EVA vs Tobin’s q
Economic Value Added (EVA) is calculated by subtracting the firm's cost of capital from its net operating profit after taxes (NOPAT), emphasizing the net value created beyond the required return. Tobin's q is derived by dividing the market value of a firm's assets by the replacement cost of those assets, highlighting market valuation relative to asset costs. EVA focuses on internal profitability measurement, while Tobin's q assesses market perception and growth potential through asset valuation.
EVA and Tobin’s q: Measuring Value Creation
Economic Value Added (EVA) quantifies value creation by calculating the net operating profit after taxes minus the capital charge, emphasizing a firm's ability to generate returns above its cost of capital. Tobin's q measures value creation as the ratio of market value of a firm's assets to their replacement cost, reflecting market perceptions of growth and investment opportunities. While EVA focuses on internal performance and efficiency, Tobin's q captures external market-based valuation, offering complementary insights into a company's value creation.
Empirical Evidence: Comparing EVA and Tobin’s q
Empirical studies demonstrate that Economic Value Added (EVA) often provides a more direct measure of firm value creation by capturing net operating profit after taxes minus the cost of capital, resulting in stronger correlations with market value and future cash flows compared to Tobin's q. Research findings indicate Tobin's q, which represents the market value of a firm divided by the replacement cost of its assets, can be influenced by market inefficiencies and asset valuation challenges, leading to less consistent predictive power. Comparative analyses in corporate finance reveal EVA's superior effectiveness in performance evaluation and investment decision-making, especially in capital-intensive industries.
Advantages of Using EVA over Tobin’s q
Economic Value Added (EVA) offers a clear measure of a firm's financial performance by quantifying value created beyond the required return on capital, making it more actionable for management decisions compared to Tobin's q, which is a market-based ratio and subject to stock price volatility. EVA directly reflects operational efficiency and capital cost, providing a precise indicator of value generation that aligns managerial incentives with shareholder wealth creation. Unlike Tobin's q, EVA can be derived from internal accounting data, enabling more consistent and timely performance evaluation.
Limitations and Criticisms of Both Metrics
Economic Value Added (EVA) faces criticism for its reliance on accounting-based data, which can be manipulated and may not fully capture market perceptions, leading to potential misrepresentation of true economic profit. Tobin's q, calculated as the market value of a firm divided by the replacement cost of its assets, is limited by difficulties in accurately estimating asset replacement costs and market valuations that are subject to short-term volatility and investor sentiment. Both metrics also struggle with capturing intangible assets, such as brand value and intellectual property, which increasingly drive firm value in modern economies.
Applications in Corporate Performance Analysis
Economic Value Added (EVA) measures a firm's financial performance by calculating the value created beyond its cost of capital, making it a key metric for assessing managerial efficiency and capital allocation. Tobin's q compares a company's market value to the replacement cost of its assets, providing insights into market valuation and investment attractiveness. Both metrics are widely applied in corporate performance analysis to guide investment decisions, strategic planning, and to evaluate shareholder value creation.
Conclusion: Choosing the Right Value Measurement Tool
Economic Value Added (EVA) offers a direct assessment of a firm's true economic profit by subtracting the cost of capital from net operating profit after taxes, making it ideal for internal performance evaluation and value-based management. Tobin's q, representing the market value of a firm's assets divided by their replacement cost, provides a market-driven perspective useful for investment decisions and assessing growth opportunities. Selecting between EVA and Tobin's q depends on whether the focus is on operational efficiency and value creation (EVA) or on market valuation and investment attractiveness (Tobin's q).
Economic Value Added (EVA) Infographic