Ice core CO2 records provide a detailed history of atmospheric carbon dioxide levels over hundreds of thousands of years, revealing critical patterns in Earth's climate cycles. These records are essential for understanding past climate changes and predicting future trends by analyzing trapped gas bubbles within ancient ice layers. Explore the full article to uncover how ice core data shapes our knowledge of climate dynamics and your role in addressing climate change.
Table of Comparison
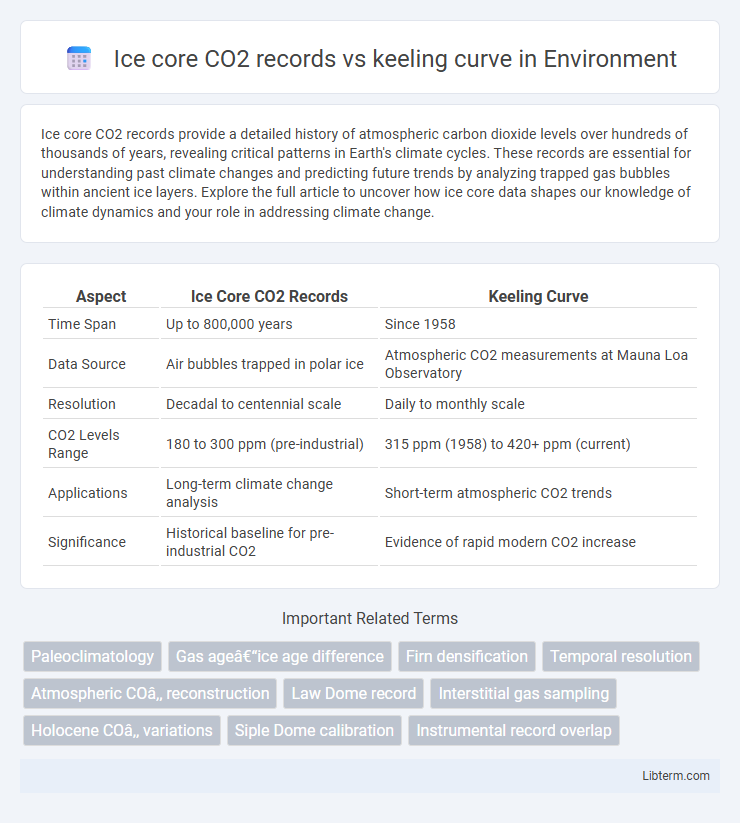
| Aspect | Ice Core CO2 Records | Keeling Curve |
|---|---|---|
| Time Span | Up to 800,000 years | Since 1958 |
| Data Source | Air bubbles trapped in polar ice | Atmospheric CO2 measurements at Mauna Loa Observatory |
| Resolution | Decadal to centennial scale | Daily to monthly scale |
| CO2 Levels Range | 180 to 300 ppm (pre-industrial) | 315 ppm (1958) to 420+ ppm (current) |
| Applications | Long-term climate change analysis | Short-term atmospheric CO2 trends |
| Significance | Historical baseline for pre-industrial CO2 | Evidence of rapid modern CO2 increase |
Introduction to Atmospheric CO2 Records
Ice core CO2 records provide historical atmospheric carbon dioxide concentrations over hundreds of thousands of years by analyzing trapped air bubbles in polar ice, revealing natural climate variability. The Keeling Curve represents continuous, precise atmospheric CO2 measurements from Mauna Loa Observatory since 1958, capturing recent anthropogenic increases. Together, these records establish a comprehensive timeline of CO2 trends critical for understanding past and present climate change.
What Are Ice Core CO2 Records?
Ice core CO2 records provide historical atmospheric carbon dioxide concentrations by analyzing trapped air bubbles within ice sheets, offering data spanning hundreds of thousands of years. These records reveal natural CO2 fluctuations over glacial and interglacial periods, establishing a baseline for pre-industrial levels around 180-280 parts per million (ppm). In contrast, the Keeling Curve is a continuous modern measurement of atmospheric CO2, initiated in 1958 at Mauna Loa Observatory, displaying a sharp rise from approximately 315 ppm to over 420 ppm today, highlighting the impact of human activities.
The Keeling Curve: Modern CO2 Measurement
The Keeling Curve represents continuous, high-precision measurements of atmospheric CO2 at Mauna Loa Observatory starting in 1958, providing real-time data on recent carbon dioxide trends. Ice core CO2 records, derived from trapped air bubbles in Antarctic and Greenland ice, offer valuable historical data spanning hundreds of thousands of years, documenting pre-industrial and glacial-interglacial cycles. Together, these datasets enable a comprehensive understanding of CO2 fluctuations from ancient times to the present, highlighting the unprecedented rise in modern CO2 levels documented by the Keeling Curve.
Timescales: Ice Cores vs. Keeling Curve
Ice core CO2 records provide a long-term perspective on atmospheric carbon dioxide levels spanning hundreds of thousands of years, revealing natural climate variability over glacial and interglacial periods. The Keeling Curve, in contrast, offers precise, high-resolution measurements of atmospheric CO2 at Mauna Loa Observatory beginning in 1958, capturing recent anthropogenic increases on an annual to decadal timescale. Together, these datasets bridge deep-time climate trends with contemporary atmospheric changes, enabling comprehensive understanding of carbon cycle dynamics.
Methodologies Behind Data Collection
Ice core CO2 records are obtained by extracting cylindrical samples from polar ice sheets, where trapped air bubbles provide direct measurements of atmospheric carbon dioxide concentrations over hundreds of thousands of years. The Keeling Curve is derived from continuous, high-precision infrared gas analyzers measuring CO2 levels in ambient air at the Mauna Loa Observatory, allowing for real-time monitoring since 1958. Both methodologies employ rigorous calibration protocols and precise instrumentation, but ice cores offer long-term historical context while the Keeling Curve captures modern atmospheric fluctuations with high temporal resolution.
Accuracy and Limitations of Each Record
Ice core CO2 records provide highly accurate historical atmospheric carbon dioxide levels dating back hundreds of thousands of years, capturing glacial and interglacial cycles with a typical temporal resolution of decades to centuries. The Keeling Curve offers continuous, high-precision measurements of atmospheric CO2 from Mauna Loa Observatory since 1958, delivering near-real-time data with monthly resolution, essential for monitoring current trends and seasonal variations. Limitations of ice core data include potential gas diffusion and age uncertainties, while the Keeling Curve's spatial representativeness is limited, primarily reflecting regional atmospheric conditions.
Long-Term CO2 Trends from Ice Cores
Ice core CO2 records reveal stable atmospheric concentrations around 180-280 ppm over the past 800,000 years, with clear cyclic variations linked to glacial and interglacial periods. These paleoclimate data contrast sharply with the Keeling Curve, which documents a sharp rise from approximately 315 ppm in 1958 to over 420 ppm today, underscoring unprecedented anthropogenic CO2 increases. The long-term trends from ice cores provide essential baseline context for understanding modern carbon dioxide escalation and its impact on climate change.
Recent CO2 Trends Shown by the Keeling Curve
The Keeling Curve provides precise, real-time measurements of atmospheric CO2 from Mauna Loa Observatory, revealing a continuous upward trend since 1958 with seasonal fluctuations. In contrast, ice core CO2 records offer long-term historical data spanning hundreds of thousands of years, showing pre-industrial levels around 280 ppm and natural variability constrained within 180-300 ppm. Recent CO2 trends highlighted by the Keeling Curve indicate unprecedented rapid increases, surpassing 420 ppm, driven primarily by fossil fuel emissions and deforestation.
Synthesizing Past and Present CO2 Data
Ice core CO2 records provide a long-term view of atmospheric carbon dioxide concentrations spanning hundreds of thousands of years, enabling reconstruction of pre-industrial baseline levels and natural fluctuations. The Keeling Curve offers precise, continuous measurements of modern CO2 levels since 1958, highlighting the rapid increase due to anthropogenic emissions. Synthesizing these datasets allows for comprehensive understanding of human impact on global carbon cycles by comparing historical natural variability with unprecedented recent trends.
Implications for Climate Change Research
Ice core CO2 records provide a historical baseline of atmospheric carbon dioxide levels spanning hundreds of thousands of years, revealing natural fluctuations and pre-industrial baselines crucial for understanding long-term climate trends. The Keeling Curve, with its precise, continuous modern measurements since 1958, captures the rapid increase in CO2 concentrations due to human activities, highlighting the unprecedented rate of current emissions. Together, these records underscore the anthropogenic impact on the carbon cycle, enabling climate scientists to quantify human-driven changes and improve predictive climate models essential for mitigation strategies.
Ice core CO2 records Infographic