Elevation contour lines represent the shape and height of the land on topographic maps, helping you understand terrain features such as hills, valleys, and slopes. These lines connect points of equal elevation, making it easier to visualize changes in altitude and plan activities like hiking or construction. Dive into the rest of the article to learn how to interpret elevation contours effectively for your next project or adventure.
Table of Comparison
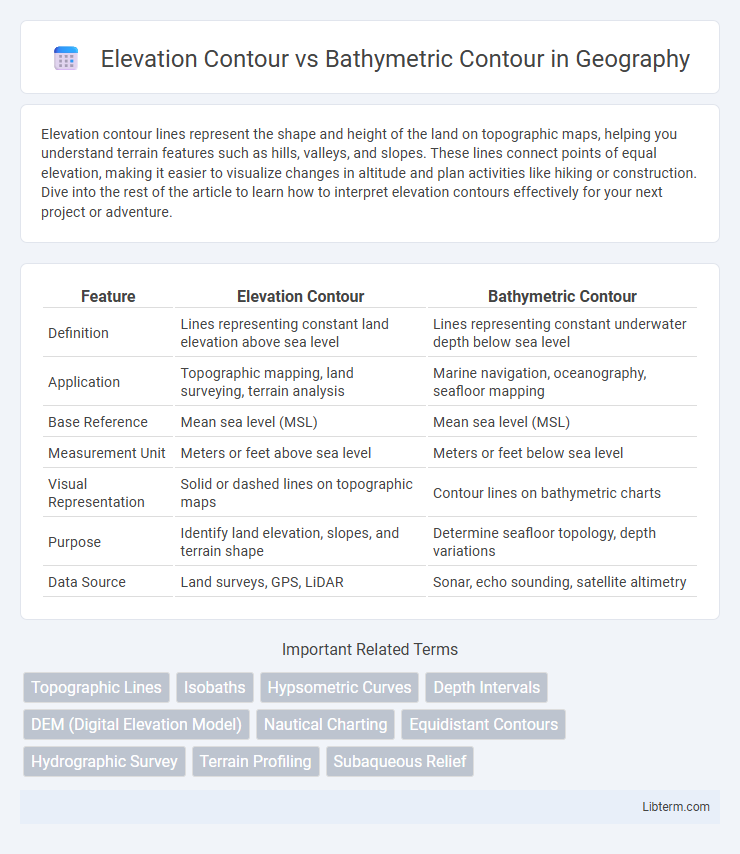
| Feature | Elevation Contour | Bathymetric Contour |
|---|---|---|
| Definition | Lines representing constant land elevation above sea level | Lines representing constant underwater depth below sea level |
| Application | Topographic mapping, land surveying, terrain analysis | Marine navigation, oceanography, seafloor mapping |
| Base Reference | Mean sea level (MSL) | Mean sea level (MSL) |
| Measurement Unit | Meters or feet above sea level | Meters or feet below sea level |
| Visual Representation | Solid or dashed lines on topographic maps | Contour lines on bathymetric charts |
| Purpose | Identify land elevation, slopes, and terrain shape | Determine seafloor topology, depth variations |
| Data Source | Land surveys, GPS, LiDAR | Sonar, echo sounding, satellite altimetry |
Introduction to Contour Mapping
Elevation contours represent lines connecting points of equal land surface altitude, essential for understanding terrain shape and slope in topographic maps. Bathymetric contours, also known as depth contours, depict lines of equal underwater depth, crucial for marine navigation and underwater geological studies. Both types of contours utilize contour intervals to illustrate three-dimensional surface variations on two-dimensional maps, aiding in spatial analysis and environmental planning.
Defining Elevation Contours
Elevation contours represent lines on a map connecting points of equal land height above a defined reference level, typically mean sea level, enabling visualization of terrain shape and slope. These contours are crucial in topographic mapping, engineering projects, and geographic studies to analyze landforms, plan construction, and assess watershed areas. Elevation contours differ from bathymetric contours, which map underwater topography by connecting points of equal water depth below sea level.
Understanding Bathymetric Contours
Bathymetric contours represent underwater topography by illustrating the depth and shape of ocean or lake beds, crucial for marine navigation and geological studies. These contours use lines to connect points of equal depth below the water surface, helping to identify features like underwater mountains, trenches, and slopes. Understanding bathymetric contours aids in safe vessel routing, underwater construction, and environmental monitoring of aquatic ecosystems.
Key Differences Between Elevation and Bathymetric Contours
Elevation contours represent lines of equal altitude above sea level on topographic maps, illustrating land surface variations such as hills and valleys. Bathymetric contours, or depth contours, depict lines of equal depth below sea level, mapping underwater features like ocean floors, lakes, and riverbeds. The primary difference lies in their reference points: elevation contours measure height above a datum (sea level), whereas bathymetric contours measure depth below the same datum.
Methods of Creating Elevation Contours
Elevation contours are created using methods such as total station surveys, LiDAR scanning, and photogrammetry, which capture precise ground surface data to represent terrain elevation on maps. These techniques involve collecting spatial coordinates and elevation points, followed by interpolation to generate contour lines indicating constant height levels. Advanced GIS software processes the data to produce detailed, accurate elevation contour maps essential for land surveying, urban planning, and engineering projects.
Bathymetric Contour Generation Techniques
Bathymetric contour generation relies on techniques such as multibeam echosounders, single-beam echosounders, and LiDAR bathymetry to accurately map underwater terrain. Advanced interpolation methods like kriging, spline, and inverse distance weighting further refine contour accuracy by estimating depths between measured points. Integration of these data sources with Geographic Information Systems (GIS) enables detailed 3D modeling of seabed topography for navigation, marine research, and habitat assessment.
Applications of Elevation Contours in Land Surveying
Elevation contours are crucial in land surveying for accurately representing the terrain's surface elevation, enabling precise calculation of slope gradients, drainage patterns, and soil erosion risks. These contours facilitate site planning, construction design, and earthworks by providing detailed topographic information essential for engineers and architects. Unlike bathymetric contours that map underwater features, elevation contours focus exclusively on land surfaces to support infrastructure development and environmental management.
Uses of Bathymetric Contours in Marine Navigation
Bathymetric contours provide critical depth information essential for safe marine navigation by mapping underwater terrain and identifying hazards such as submerged rocks, shipwrecks, and trenches. These contours enable mariners to plot safe courses, avoid grounding, and optimize routes for fuel efficiency in diverse marine environments. Unlike elevation contours that illustrate land topography, bathymetric contours specifically enhance the understanding of ocean floor features vital for commercial shipping, fishing, and recreational boating.
Interpretation Challenges: Elevation vs Bathymetric Contours
Elevation contours represent land surface features above sea level, while bathymetric contours depict underwater terrain below sea level, creating distinct interpretation challenges due to their differing reference points. Elevation contours are typically easier to interpret for land navigation as they correspond with visible terrain features, whereas bathymetric contours require understanding of underwater topography and potential variations in water depth. Misreading these contours can lead to navigational errors; thus, specialized knowledge is needed to accurately interpret depth-related data in marine environments versus elevation data on land.
Future Trends in Contour Mapping Technologies
Elevation contours and bathymetric contours will increasingly benefit from advances in remote sensing technologies such as LiDAR and multibeam sonar, enabling higher resolution and more accurate topographic and underwater mapping. Integration of AI algorithms and machine learning models will enhance the interpretation and real-time updating of contour data, supporting applications in environmental monitoring and marine navigation. Future trends also point toward cloud-based platforms and GIS interoperability, allowing seamless sharing and collaborative analysis of elevation and bathymetric contours across industries.
Elevation Contour Infographic