A bathymetric curve represents lines of equal depth in a body of water, providing crucial information about underwater terrain and topography. These curves are essential for navigation, marine construction, and environmental studies, helping to map the seafloor accurately. Discover how bathymetric curves can enhance your understanding of underwater landscapes by reading the full article.
Table of Comparison
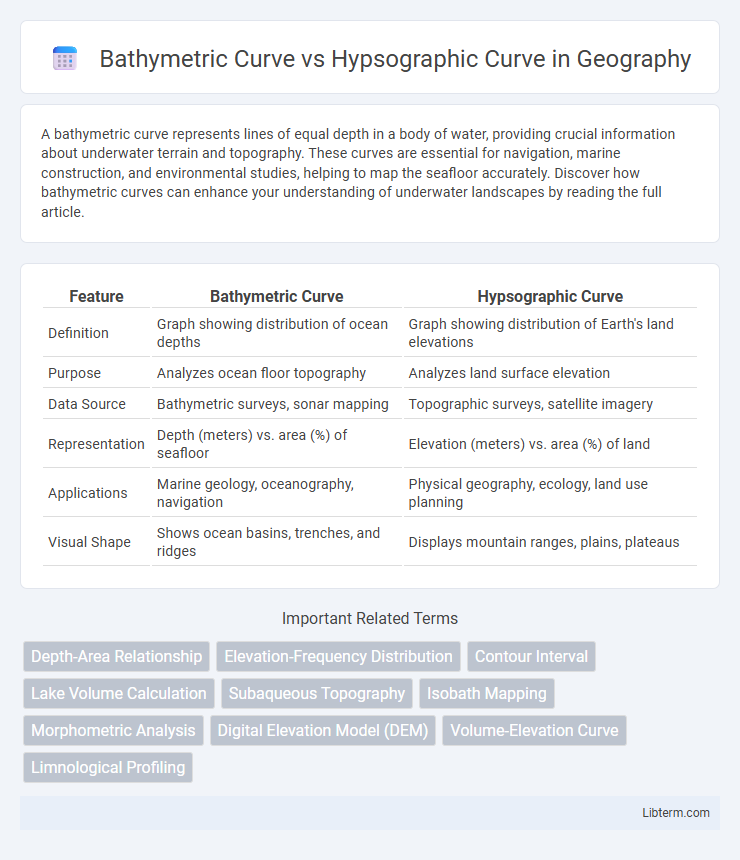
| Feature | Bathymetric Curve | Hypsographic Curve |
|---|---|---|
| Definition | Graph showing distribution of ocean depths | Graph showing distribution of Earth's land elevations |
| Purpose | Analyzes ocean floor topography | Analyzes land surface elevation |
| Data Source | Bathymetric surveys, sonar mapping | Topographic surveys, satellite imagery |
| Representation | Depth (meters) vs. area (%) of seafloor | Elevation (meters) vs. area (%) of land |
| Applications | Marine geology, oceanography, navigation | Physical geography, ecology, land use planning |
| Visual Shape | Shows ocean basins, trenches, and ridges | Displays mountain ranges, plains, plateaus |
Introduction to Bathymetric and Hypsographic Curves
Bathymetric curves represent the underwater topography by illustrating the depth contours of ocean floors, lakes, or other water bodies, providing crucial data for marine navigation and geological studies. Hypsographic curves depict the distribution of Earth's surface elevations above sea level, showing the proportion of land area at various altitudes, essential for understanding landform patterns and climate impact. Both curves are fundamental tools in geomorphology and Earth sciences, aiding in the visualization of terrain and underwater features through elevation and depth variations.
Defining Bathymetric Curve: Key Concepts
Bathymetric curves represent the underwater equivalent of topographic contours, illustrating the depth variations of ocean floors, lakes, and other water bodies by connecting points of equal depth. These curves are essential for understanding seafloor morphology, aiding in marine navigation, geological surveys, and habitat mapping. Unlike hypsographic curves, which depict land elevation, bathymetric curves focus exclusively on subaqueous terrain, providing critical data for oceanographic research and environmental monitoring.
Understanding Hypsographic Curve: An Overview
Hypsographic curve illustrates the distribution of Earth's surface elevations and ocean depths, highlighting the proportion of land area at various heights above sea level and ocean floor depths below sea level. This curve is essential for understanding Earth's topography, showing distinct continental and oceanic elevation zones. Unlike the bathymetric curve, which focuses solely on underwater depth variations, the hypsographic curve provides a comprehensive view of both terrestrial and submarine elevations.
Fundamental Differences between Bathymetric and Hypsographic Curves
Bathymetric curves represent the depth distribution of ocean floors, illustrating variations in underwater topography such as trenches and continental slopes. Hypsographic curves depict the distribution of Earth's surface elevations, highlighting the proportion of land at different altitudes including mountains, plateaus, and plains. The fundamental difference lies in their focus: bathymetric curves analyze submerged terrain, while hypsographic curves quantify terrestrial elevation features, both essential for understanding Earth's geomorphology.
Data Collection Methods for Bathymetric and Hypsographic Analyses
Bathymetric curve data collection relies on sonar systems, including multibeam and single-beam echo sounders, which emit sound pulses to measure underwater terrain depths accurately. Hypsographic curve development uses topographic surveying techniques such as GPS and LiDAR to map land elevation and surface contours with high precision. Both methods integrate satellite imagery and Geographic Information System (GIS) processing to enhance spatial analysis and create detailed elevation and depth profiles.
Visualization Techniques: Graphing the Curves
Bathymetric curves visualize underwater topography by graphing depth contours, typically using color gradients or contour lines to represent varying seafloor depths. Hypsographic curves plot the distribution of land elevation versus surface area, often displayed as cumulative frequency graphs or elevation histograms. Advanced visualization techniques for both include digital elevation models (DEMs) and interactive 3D graphs, enhancing the interpretation of terrain and ocean floor data.
Applications of Bathymetric Curves in Oceanography
Bathymetric curves provide detailed representations of underwater topography, crucial for mapping seafloor features such as trenches, ridges, and continental shelves. Oceanographers use these curves to model ocean circulation, study habitat distributions, and support submarine navigation by identifying depth variations. Bathymetric data also assist in seismic research and resource exploration, enhancing understanding of geological processes beneath the ocean floor.
Uses of Hypsographic Curves in Geography and Geomorphology
Hypsographic curves are crucial in geography and geomorphology for illustrating the distribution of Earth's surface elevations, helping to analyze landform patterns and assess terrain variability. These curves assist in identifying elevation ranges that influence climate zones, vegetation types, and watershed boundaries, providing insights into ecosystem distribution and geological processes. Hypsographic data supports flood risk assessment, land use planning, and soil erosion studies by linking topographic variation with environmental and morphodynamic factors.
Comparative Analysis: Advantages and Limitations
Bathymetric curves provide detailed representations of underwater terrain by mapping ocean floor depths, essential for marine navigation and geological research, whereas hypsographic curves illustrate land elevation distribution, critical for understanding topography and watershed management. Bathymetric curves offer precise insights into seabed morphology but are limited by data collection challenges in deep or inaccessible ocean regions, while hypsographic curves excel in terrestrial elevation analysis but cannot account for submarine features. Both curves complement each other in earth sciences by integrating oceanic and terrestrial elevation data, yet their effectiveness depends on the resolution and accuracy of measurements inherent to their respective technologies.
Conclusion: Choosing the Right Curve for Geographic Studies
Selecting the appropriate curve between bathymetric and hypsographic depends on the specific geographic study focus; bathymetric curves effectively represent underwater terrain and ocean depth distributions, while hypsographic curves detail land elevation and topographic variability. For marine geology, oceanography, and seafloor mapping, bathymetric data provides crucial insight into abyssal plains, continental slopes, and submarine features. Conversely, applications in geomorphology, land use planning, and environmental assessment benefit from hypsographic curves that illustrate elevations related to mountain ranges, plateaus, and valleys.
Bathymetric Curve Infographic