A topographic profile illustrates the elevation changes along a specific line across a landscape, providing a side view of terrain features. This visualization helps in understanding slopes, hills, valleys, and other geological formations essential for planning construction, hiking, or environmental studies. Explore the rest of the article to deepen your knowledge of creating and interpreting topographic profiles effectively.
Table of Comparison
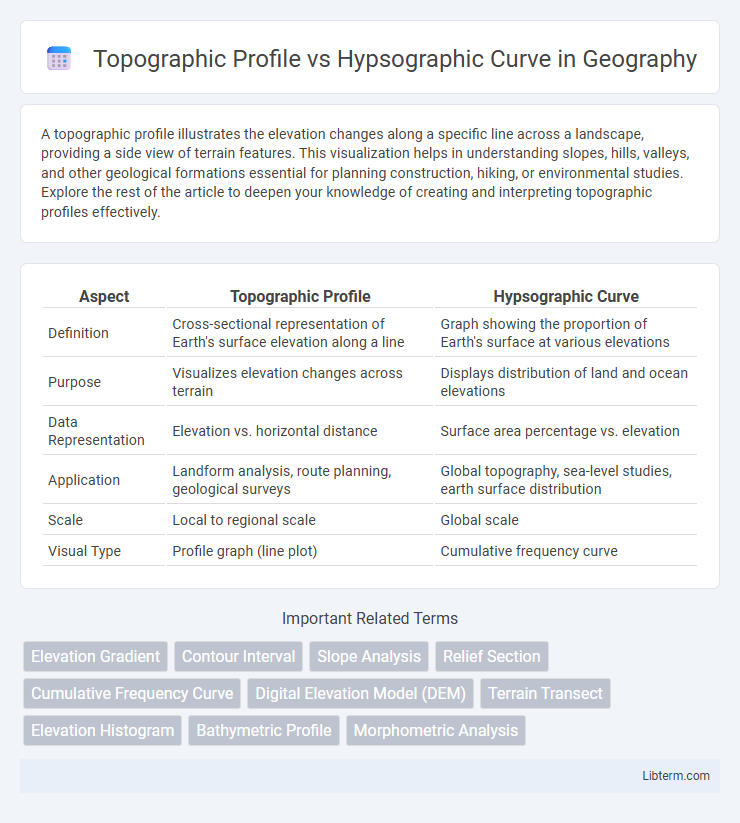
| Aspect | Topographic Profile | Hypsographic Curve |
|---|---|---|
| Definition | Cross-sectional representation of Earth's surface elevation along a line | Graph showing the proportion of Earth's surface at various elevations |
| Purpose | Visualizes elevation changes across terrain | Displays distribution of land and ocean elevations |
| Data Representation | Elevation vs. horizontal distance | Surface area percentage vs. elevation |
| Application | Landform analysis, route planning, geological surveys | Global topography, sea-level studies, earth surface distribution |
| Scale | Local to regional scale | Global scale |
| Visual Type | Profile graph (line plot) | Cumulative frequency curve |
Introduction to Topographic Profiles and Hypsographic Curves
Topographic profiles represent a cross-sectional view of terrain elevation along a specific line, illustrating the changes in land surface height over distance. Hypsographic curves display the distribution of Earth's surface elevations relative to sea level, highlighting the proportion of land area at different altitude intervals. Both tools are essential in geomorphology for understanding landscape features and elevation patterns.
Defining Topographic Profiles
Topographic profiles are cross-sectional diagrams that represent the vertical elevation of the land surface along a specific line, illustrating changes in terrain features such as hills, valleys, and slopes. These profiles provide detailed information on the gradient and relief of a region, facilitating the analysis of landforms and geological structures. In contrast, hypsographic curves summarize the distribution of land elevation across an entire area, showing the proportion of land at various altitudes rather than a linear elevation view.
Understanding Hypsographic Curves
Hypsographic curves represent the distribution of Earth's surface elevations by plotting the cumulative area above various elevations, providing critical insight into global topography and landform patterns. Unlike topographic profiles that show elevation changes along a specific line or transect, hypsographic curves offer a comprehensive view of the relative proportions of land at different altitudes. These curves are essential for understanding geomorphological processes, watershed management, and climate impact analysis on terrain.
Key Differences Between Topographic Profiles and Hypsographic Curves
Topographic profiles represent a vertical cross-section of the Earth's surface, illustrating changes in elevation along a specific line, whereas hypsographic curves depict the distribution of Earth's surface area at different elevations across a region or the entire globe. Topographic profiles are used for localized analysis of terrain features such as mountains, valleys, and slopes, while hypsographic curves provide a broader quantitative assessment of land elevation distribution, often used in geomorphology and climate studies. The key difference lies in their dimensional focus: the profile provides a linear elevation view, while the curve offers a statistical summary of elevation extent.
Methods of Generating Topographic Profiles
Topographic profiles are generated by plotting elevation points along a specific line on a map, using contour lines or digital elevation models to create a cross-sectional view of the terrain. Methods include manual extraction from topographic maps by sampling elevation at intervals and interpolation, or utilizing Geographic Information System (GIS) tools to automate profile generation from high-resolution elevation datasets. These techniques provide detailed vertical representations of landforms, essential for geological analysis, engineering projects, and landscape planning.
Techniques for Creating Hypsographic Curves
Techniques for creating hypsographic curves involve analyzing elevation distribution across given land surfaces using digital elevation models (DEMs) and GIS software to generate precise altitude-area relationships. These methods rely on contour mapping and statistical smoothing to plot cumulative land area against elevation, providing detailed representations of terrain. Unlike topographic profiles that depict linear cross-sections of elevation, hypsographic curves emphasize volumetric land distribution across elevation intervals, critical for geomorphological and hydrological assessments.
Applications in Geomorphology and Mapping
Topographic profiles provide detailed cross-sectional views of terrain elevation changes, essential for analyzing landform structures and planning infrastructure in geomorphology. Hypsographic curves graphically represent the distribution of elevation relative to area, enabling the assessment of landscape evolution and watershed management. Both tools enhance mapping accuracy and natural resource management by offering complementary perspectives on terrain and altitude variations.
Visualization and Interpretation of Data
A topographic profile visually represents the changes in elevation along a specific line on the Earth's surface, providing a cross-sectional view that helps interpret terrain features such as slopes and ridges. A hypsographic curve, on the other hand, illustrates the distribution of land elevation across an area by plotting the cumulative percentage of land surface against elevation. Together, these tools enable detailed analysis of landscape characteristics by combining elevation distribution patterns from the hypsographic curve with spatially explicit elevation changes from the topographic profile.
Advantages and Limitations of Each Method
Topographic profiles provide detailed cross-sectional views of land elevation along a specific line, offering precise visualization of terrain features but are limited in representing overall landscape diversity. Hypsographic curves plot the distribution of Earth's surface area at varying elevations, enabling comprehensive analysis of elevation patterns across large regions, though they lack spatial detail and specific terrain shape insights. Combining both methods enhances geographic understanding by balancing detailed terrain visualization with broad elevation distribution assessment.
Conclusion: Choosing Between Topographic Profiles and Hypsographic Curves
Topographic profiles offer detailed cross-sectional views of landforms, ideal for site-specific analysis and engineering projects, while hypsographic curves provide comprehensive elevation distribution data critical for regional or global geomorphological studies. Selecting between them depends on the spatial scale and precision required; use topographic profiles for localized terrain assessment and hypsographic curves for understanding broader elevation trends and landscape evolution. Integrating both tools enhances terrain interpretation, balancing fine-scale detail with overall elevation patterns.
Topographic Profile Infographic