An elevation histogram visually represents the distribution of altitudes within a specific area, highlighting terrain variations and landscape features. This tool is essential for geographers, environmental scientists, and urban planners to analyze topography and make informed decisions about land use and development. Explore the rest of this article to understand how elevation histograms can enhance your spatial analysis projects.
Table of Comparison
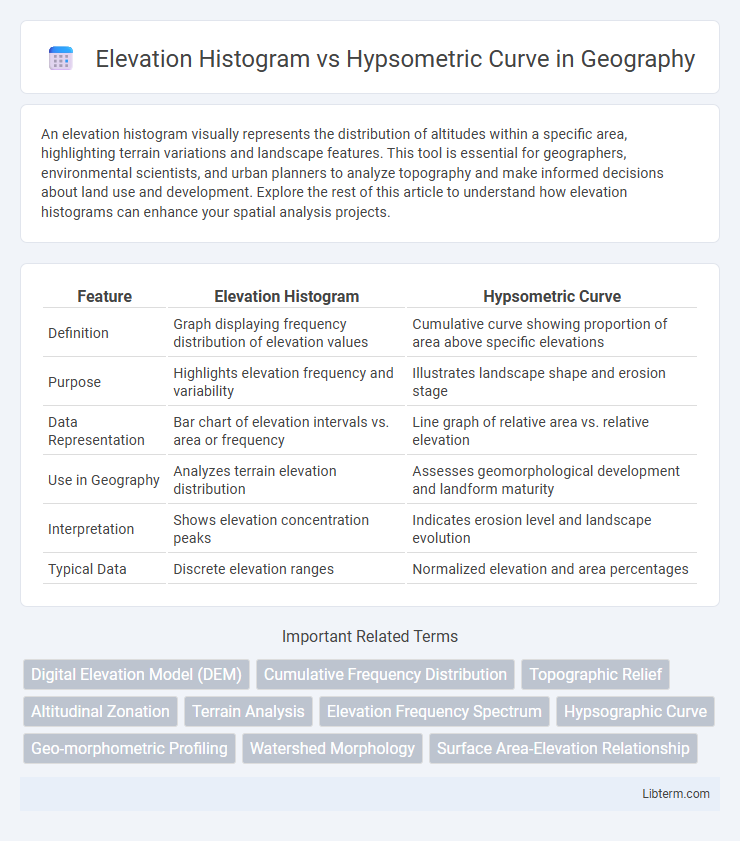
| Feature | Elevation Histogram | Hypsometric Curve |
|---|---|---|
| Definition | Graph displaying frequency distribution of elevation values | Cumulative curve showing proportion of area above specific elevations |
| Purpose | Highlights elevation frequency and variability | Illustrates landscape shape and erosion stage |
| Data Representation | Bar chart of elevation intervals vs. area or frequency | Line graph of relative area vs. relative elevation |
| Use in Geography | Analyzes terrain elevation distribution | Assesses geomorphological development and landform maturity |
| Interpretation | Shows elevation concentration peaks | Indicates erosion level and landscape evolution |
| Typical Data | Discrete elevation ranges | Normalized elevation and area percentages |
Understanding Elevation Histograms
Elevation histograms graphically represent the frequency distribution of terrain elevations within a specified area, highlighting how many pixels or units fall into distinct elevation bins. This visualization allows for quick assessment of landscape variability, indicating dominant elevation ranges and terrain heterogeneity. Unlike hypsometric curves, which plot cumulative area against elevation, elevation histograms provide detailed insight into elevation frequency, proving essential for geomorphological analysis and landform classification.
Introduction to Hypsometric Curves
Hypsometric curves graphically represent the distribution of land area at various elevation levels, providing insights into topographic relief and erosion stages within a watershed or region. Unlike elevation histograms that display frequency counts of elevation values, hypsometric curves plot the normalized cumulative area against normalized elevation, allowing comparison across different terrains. These curves are essential for understanding landscape evolution, watershed characteristics, and geomorphological processes.
Key Differences Between Elevation Histograms and Hypsometric Curves
Elevation histograms display the frequency distribution of terrain elevations by categorizing land area into elevation bins, highlighting how much area exists at each height. Hypsometric curves illustrate the cumulative proportion of total land area below a given elevation, providing insight into landscape development and erosion patterns. Key differences lie in their representation: elevation histograms emphasize elevation frequency, while hypsometric curves emphasize cumulative area relationships, making each tool suitable for distinct geomorphological analyses.
Data Representation in Elevation Histograms
Elevation histograms visually represent the frequency distribution of elevation values within a specified area, providing a clear statistical overview of terrain characteristics. These histograms aggregate elevation data into discrete bins, allowing for precise analysis of elevation frequency and variability, essential for geomorphological studies and environmental modeling. Unlike hypsometric curves, which depict cumulative area distribution against elevation, elevation histograms emphasize the quantity of land at each elevation interval, enhancing detailed terrain classification and landform identification.
Analytical Functions of Hypsometric Curves
Hypsometric curves provide analytical functions that quantify the proportion of a landscape's area at varying elevations, enabling detailed assessments of terrain morphology and watershed analysis. These functions facilitate the understanding of erosion stages, sediment distribution, and watershed development by representing the cumulative distribution of elevations. Unlike elevation histograms that display frequency distributions, hypsometric curves offer integrated analytical insights essential for geomorphological and hydrological modeling.
Applications in Geographic and Environmental Studies
Elevation histograms provide frequency distributions of elevation values, essential for identifying dominant terrain heights and analyzing landform patterns in geographic studies. Hypsometric curves, illustrating the cumulative area-elevation relationship, are crucial for assessing landscape development stages, watershed characteristics, and erosion processes in environmental research. Both tools support watershed management, land use planning, and ecological modeling by offering complementary terrain representation methods.
Interpreting Landscape Patterns with Both Tools
Elevation histograms provide a frequency distribution of elevation values, enabling rapid identification of dominant altitude classes and terrain variability within a landscape. Hypsometric curves illustrate the cumulative area above each elevation level, revealing landscape maturity and erosion stages by showing how elevation is distributed across the entire terrain surface. Combining both tools enhances interpretation of topographic features, with elevation histograms highlighting elevation frequency and hypsometric curves emphasizing landscape evolutionary processes.
Pros and Cons of Elevation Histograms vs Hypsometric Curves
Elevation histograms provide a straightforward frequency distribution of elevation values, making it easier to visualize the prevalence of specific elevation ranges but lack spatial context and cumulative area insights. Hypsometric curves display the cumulative distribution of land area versus elevation, offering valuable information about terrain development and geomorphology, yet can be more complex to interpret for quick elevation frequency analysis. Elevation histograms are advantageous for simple statistical summaries, whereas hypsometric curves excel in representing the relationship between land area and elevation over a landscape.
Visualization Techniques for Terrain Analysis
Elevation histograms provide a frequency distribution of terrain elevations, enabling quick identification of dominant altitude ranges and elevation variability. Hypsometric curves depict cumulative area percentages relative to elevation, offering insight into the geomorphological characteristics and slope profiles of a landscape. Combining elevation histograms and hypsometric curves enhances terrain analysis visualization by delivering complementary quantitative and spatial elevation information crucial for geomorphology, hydrology, and soil studies.
Choosing the Right Method for Your Study
Elevation histograms provide a straightforward frequency distribution of elevations, making them ideal for analyzing terrain roughness and identifying dominant elevation ranges. Hypsometric curves offer cumulative area-elevation relationships, useful for understanding watershed characteristics and geomorphological evolution. Select elevation histograms for discrete elevation class analysis and hypsometric curves for assessing landscape development and erosion stages in geomorphology studies.
Elevation Histogram Infographic