A topographic profile visually represents the elevation changes along a specific line on a map, providing a cross-sectional view of the terrain. It highlights key landscape features such as hills, valleys, and slopes, aiding in the understanding of geographical formations and planning activities. Explore the rest of this article to learn how to create and interpret topographic profiles for your projects.
Table of Comparison
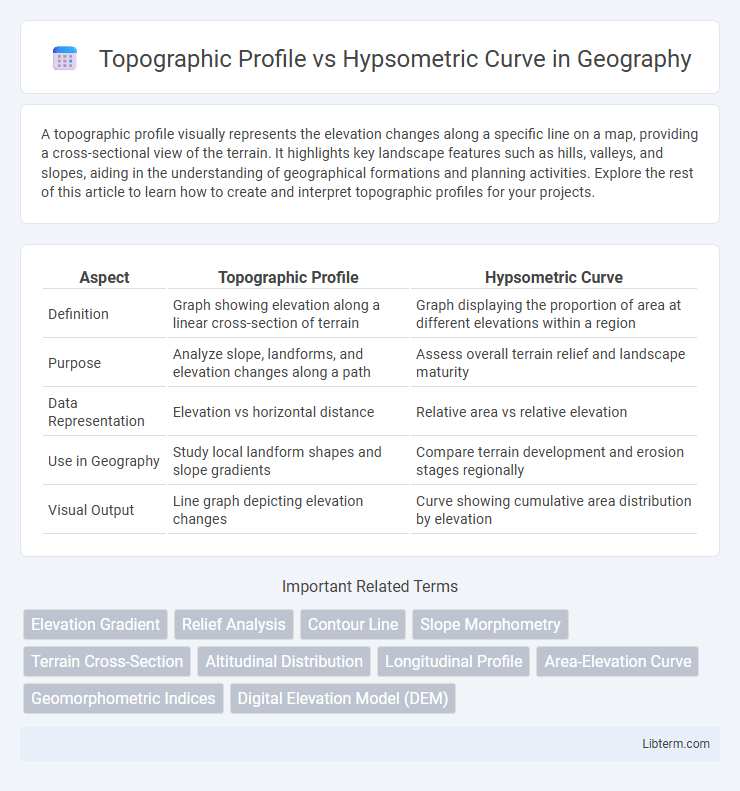
| Aspect | Topographic Profile | Hypsometric Curve |
|---|---|---|
| Definition | Graph showing elevation along a linear cross-section of terrain | Graph displaying the proportion of area at different elevations within a region |
| Purpose | Analyze slope, landforms, and elevation changes along a path | Assess overall terrain relief and landscape maturity |
| Data Representation | Elevation vs horizontal distance | Relative area vs relative elevation |
| Use in Geography | Study local landform shapes and slope gradients | Compare terrain development and erosion stages regionally |
| Visual Output | Line graph depicting elevation changes | Curve showing cumulative area distribution by elevation |
Introduction to Topographic Profile and Hypsometric Curve
A topographic profile represents a cross-sectional view of the land's elevation along a specific line, illustrating changes in terrain height and slope. In contrast, a hypsometric curve depicts the distribution of elevations within a defined area, showing the proportion of land surface at various heights. These tools are essential in geomorphology for analyzing landform patterns, watershed characteristics, and landscape evolution.
Defining Topographic Profile
A topographic profile is a cross-sectional view of the Earth's surface along a specific line, representing changes in elevation and terrain features such as hills, valleys, and slopes. It visually illustrates the vertical dimension of the landscape, enabling analysis of landform shapes and gradients. Topographic profiles are essential for understanding watershed boundaries, planning infrastructure, and conducting geological assessments.
Understanding Hypsometric Curve
Understanding the hypsometric curve is essential for analyzing the distribution of elevations within a particular land area, representing the proportion of land at different altitudes as a cumulative graph. Unlike the topographic profile, which shows a cross-sectional view of terrain elevation along a specific line, the hypsometric curve provides a holistic view of the landscape's vertical dimension and helps in assessing erosion, geomorphology, and watershed characteristics. Its application in geomorphological studies assists researchers in identifying stages of landscape development and understanding the balance between uplift and erosion processes.
Key Differences Between Topographic Profile and Hypsometric Curve
Topographic profiles represent a two-dimensional cross-sectional view of terrain elevation along a specific line, highlighting variations in landforms such as hills, valleys, and slopes. Hypsometric curves display the cumulative distribution of elevation data over an entire area, illustrating the proportion of land at different heights and providing insights into watershed stages and landscape maturity. Unlike topographic profiles that provide localized elevation changes, hypsometric curves offer a broader statistical analysis of terrain elevation across an entire region.
Methods for Creating Topographic Profiles
Topographic profiles are created by plotting elevation data along a linear transect, typically extracted from digital elevation models (DEMs) or topographic maps, to visually represent terrain relief in cross-section. Methods include using GIS software to sample elevation points at regular intervals along the chosen path and graphing these points to reveal slope gradients and landform features. In contrast, hypsometric curves display the distribution of elevations over an entire area rather than a specific transect, offering a cumulative area-versus-elevation representation rather than a linear cross-section.
Techniques for Constructing Hypsometric Curves
Hypsometric curves are constructed by plotting the proportion of a landform's area against elevation, typically derived from digital elevation models (DEMs) or contour maps using GIS software for accurate spatial analysis. Techniques involve extracting elevation data, calculating relative area values, and generating cumulative frequency distributions to visualize the terrain's volume and erosional stages. This method contrasts with topographic profiles, which represent elevation changes along a linear transect rather than cumulative area distribution across all elevations.
Applications of Topographic Profiles in Geography
Topographic profiles provide detailed cross-sectional views of the Earth's surface, essential for analyzing landforms, slope stability, and watershed management in geography. These profiles help geographers assess elevation changes and terrain features crucial for urban planning, infrastructure development, and environmental impact studies. Unlike hypsometric curves that depict area-elevation relationships, topographic profiles offer precise information for site-specific geological and geomorphological applications.
Uses of Hypsometric Curves in Geomorphology
Hypsometric curves are essential in geomorphology for analyzing landscape development, watershed characteristics, and erosion stages by depicting the distribution of elevation relative to area. They help identify geomorphic processes such as uplift, denudation, and sediment deposition by revealing the maturity and stability of landforms. This contrasts with topographic profiles, which provide linear elevation cross-sections useful for structural interpretation but lack the comprehensive area-based elevation distribution insights offered by hypsometric curves.
Comparative Benefits and Limitations
Topographic profiles provide a linear cross-sectional view of terrain elevation, enabling precise analysis of slope gradients and landform shapes, which is ideal for detailed geological or engineering assessments. Hypsometric curves illustrate the distribution of elevation across an entire region, offering valuable insights into basin development, erosion stages, and landscape evolution but lack specific spatial orientation. While topographic profiles deliver localized, directional detail essential for infrastructure planning, hypsometric curves enable broader geomorphological interpretations, though they may oversimplify complex topography.
Conclusion: Selecting the Right Tool for Terrain Analysis
Topographic profiles provide a detailed cross-sectional view of terrain elevation changes along a specific line, making them ideal for analyzing slope gradients, landform shapes, and engineering projects. Hypsometric curves offer a broader perspective by representing the distribution of elevation across an entire area, essential for understanding overall landscape maturity, erosion stages, and watershed characteristics. Choosing between these tools depends on the analysis scale and objective, with topographic profiles suited for localized, linear investigations and hypsometric curves better for regional, volumetric assessments.
Topographic Profile Infographic