A flow map visually represents sequential steps or processes, making complex information easier to understand and follow. It helps you organize tasks, track progress, and identify potential bottlenecks in workflows. Explore the rest of the article to learn how implementing a flow map can improve your productivity and clarity.
Table of Comparison
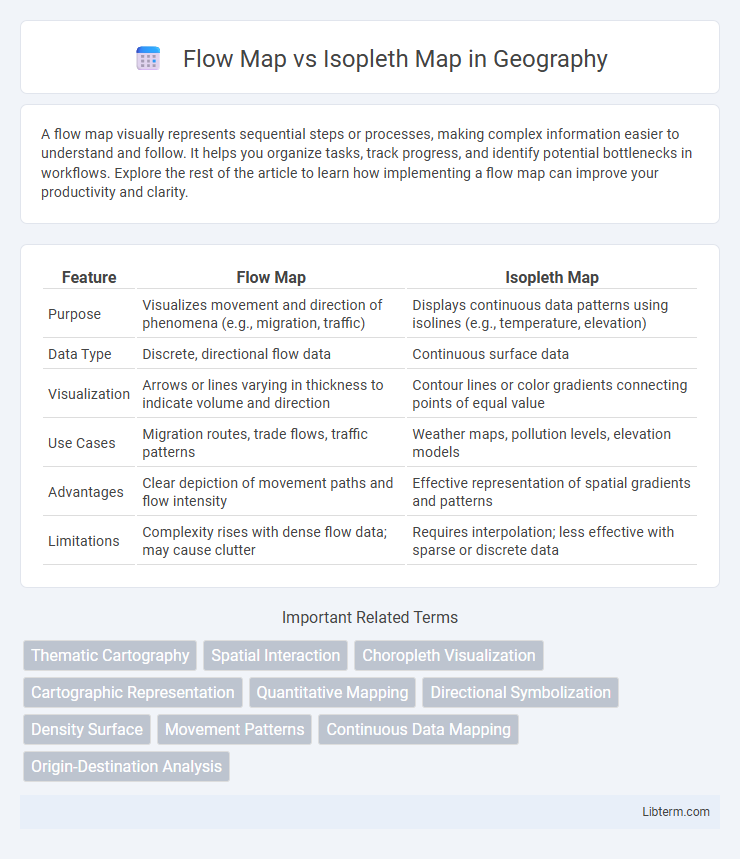
| Feature | Flow Map | Isopleth Map |
|---|---|---|
| Purpose | Visualizes movement and direction of phenomena (e.g., migration, traffic) | Displays continuous data patterns using isolines (e.g., temperature, elevation) |
| Data Type | Discrete, directional flow data | Continuous surface data |
| Visualization | Arrows or lines varying in thickness to indicate volume and direction | Contour lines or color gradients connecting points of equal value |
| Use Cases | Migration routes, trade flows, traffic patterns | Weather maps, pollution levels, elevation models |
| Advantages | Clear depiction of movement paths and flow intensity | Effective representation of spatial gradients and patterns |
| Limitations | Complexity rises with dense flow data; may cause clutter | Requires interpolation; less effective with sparse or discrete data |
Introduction to Flow Maps and Isopleth Maps
Flow maps visually represent movement patterns between locations using lines of varying thickness or color to indicate volume and direction, making them ideal for illustrating migration, traffic, or trade routes. Isopleth maps use continuous contour lines to display spatial variations in data such as temperature, rainfall, or population density, providing a clear depiction of gradients across geographic areas. Both map types serve distinct purposes in geographic analysis: flow maps emphasize connectivity and flow, while isopleth maps highlight spatial distribution and intensity.
Definition of Flow Maps
Flow maps visualize movement and direction of objects, people, or information between locations using arrows or lines scaled by quantity. They emphasize spatial interactions and facilitate understanding of migration patterns, traffic flows, or trade routes. Unlike isopleth maps that depict continuous data gradients, flow maps highlight dynamic connections and magnitude of flows across geographic spaces.
Definition of Isopleth Maps
Isopleth maps represent data through continuous shaded or contour areas, where lines connect points of equal value such as temperature, elevation, or population density. They visualize spatial variations by depicting gradients and transitions across geographic regions, making them useful for climate studies, topography, and demographic analysis. Unlike flow maps that emphasize movement and direction between locations, isopleth maps focus on the distribution and intensity of a variable across space.
Purpose and Applications of Flow Maps
Flow maps visualize movement and connections between locations, optimizing representation of quantity and direction for transportation, migration, and trade. They effectively illustrate dynamic patterns such as traffic flows, trade routes, and information exchange, enabling better analysis of spatial relationships. Common applications include urban planning, logistics optimization, and epidemiological tracking to reveal trends and intensities in spatial interactions.
Purpose and Use Cases of Isopleth Maps
Isopleth maps are designed to represent continuous data variations across geographic areas, such as temperature, precipitation, or population density, using contour lines or color gradations. They are essential in meteorology, environmental science, and public health for visualizing gradients and spatial patterns that reveal trends and anomalies over regions. Unlike flow maps, which emphasize movement and connections, isopleth maps focus on illustrating the intensity and distribution of variables at specific locations.
Key Differences: Flow Map vs Isopleth Map
Flow maps visualize movement between locations using lines or arrows representing direction and volume, ideal for showing migration, traffic, or trade patterns. Isopleth maps display continuous data across geographic areas using contour lines or color gradients to represent variations in phenomena like temperature, elevation, or population density. Unlike isopleth maps that emphasize spatial distribution intensity, flow maps focus on dynamic connections and directional flux between points.
Data Representation and Visual Elements
Flow maps visualize movement or flow between locations using arrows or lines of varying thickness, with thickness indicating volume or intensity of data such as migration patterns or traffic flow. Isopleth maps represent continuous data fields using contour lines or color gradients to depict variations in variables like temperature, precipitation, or population density across geographic areas. The key visual difference lies in flow maps emphasizing directional connections and movement, while isopleth maps highlight spatial gradients and distribution patterns.
Advantages and Limitations of Flow Maps
Flow maps visually represent movement quantities, such as migration or trade flows, by varying line thickness to convey volume, offering clear insights into patterns and connections. They excel in illustrating direction and magnitude but can become cluttered and difficult to interpret with complex or overlapping flows, reducing readability. Limitations include challenges in accurately scaling lines for very dense data and difficulty in representing non-directional spatial distributions compared to isopleth maps.
Advantages and Limitations of Isopleth Maps
Isopleth maps excel at visualizing continuous spatial data, such as temperature or rainfall, by using smooth color gradients or contour lines to represent varying values, which allows for easy interpretation of spatial patterns and trends. However, their limitation lies in the need for sufficient and evenly distributed data points; sparse or uneven data can lead to inaccurate or misleading interpolations. Unlike flow maps that depict movement and direction between locations, isopleth maps emphasize the intensity or concentration of a single variable across a geographic area.
Choosing Between Flow Map and Isopleth Map
Flow maps effectively visualize the movement and volume of goods, people, or information between locations, making them ideal for illustrating migration patterns, trade routes, or traffic flows. Isopleth maps depict continuous data distributions, such as temperature, rainfall, or pollution levels, using contour lines to represent gradients and trends across geographic areas. Choosing between a flow map and an isopleth map depends on whether the analysis requires understanding directional flows and connections or spatial variations and intensities of a specific variable.
Flow Map Infographic