An isohyet is a line on a map that connects points receiving equal amounts of rainfall, providing critical insight into precipitation distribution across a region. Understanding isohyets helps in water resource management, agriculture planning, and flood risk assessment by illustrating spatial rainfall patterns. Explore the rest of the article to learn how isohyets can enhance your grasp of weather and climate data.
Table of Comparison
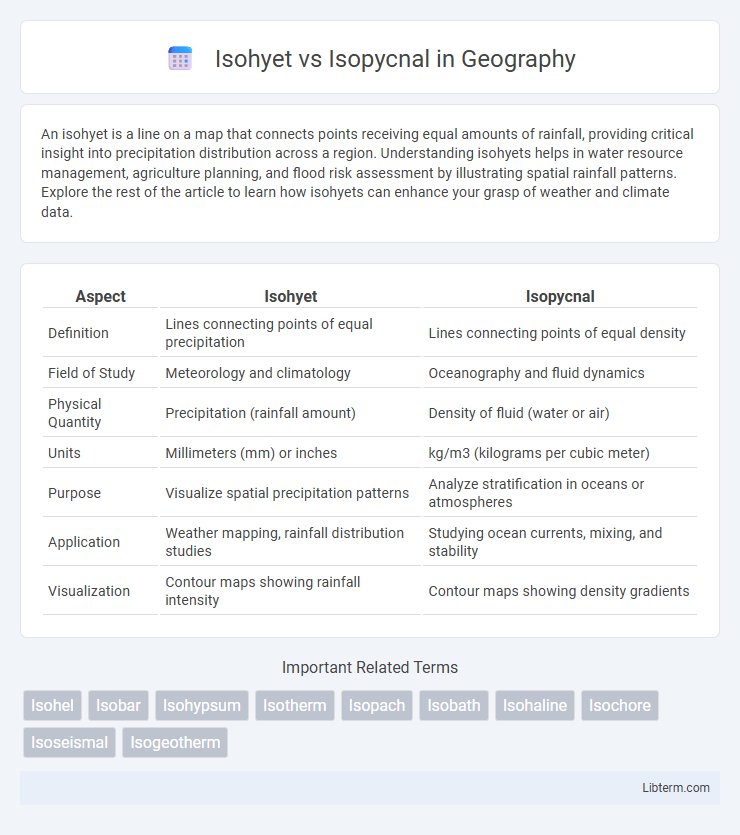
| Aspect | Isohyet | Isopycnal |
|---|---|---|
| Definition | Lines connecting points of equal precipitation | Lines connecting points of equal density |
| Field of Study | Meteorology and climatology | Oceanography and fluid dynamics |
| Physical Quantity | Precipitation (rainfall amount) | Density of fluid (water or air) |
| Units | Millimeters (mm) or inches | kg/m3 (kilograms per cubic meter) |
| Purpose | Visualize spatial precipitation patterns | Analyze stratification in oceans or atmospheres |
| Application | Weather mapping, rainfall distribution studies | Studying ocean currents, mixing, and stability |
| Visualization | Contour maps showing rainfall intensity | Contour maps showing density gradients |
Introduction to Isohyets and Isopycnals
Isohyets are lines on a map that connect points of equal rainfall, essential for visualizing precipitation distribution and hydrological studies. Isopycnals represent surfaces or lines of constant density within a fluid, crucial for understanding oceanographic and atmospheric processes. Both concepts are fundamental in environmental science, aiding in the analysis of spatial variations in moisture and fluid density.
Defining Isohyet: Meaning and Uses
Isohyet refers to a line on a map connecting points of equal rainfall, essential for meteorological analysis and hydrological studies. This contour line helps in understanding precipitation distribution, flood forecasting, and water resource management by visualizing spatial rainfall variations. In contrast, an isopycnal represents a surface of equal density in fluid systems, mainly used in oceanography and atmospheric sciences to study stratification and mixing processes.
Understanding Isopycnal: Definition and Applications
Isopycnal surfaces represent layers in a fluid where the density remains constant, playing a crucial role in oceanography and meteorology for analyzing stratification and fluid dynamics. Unlike isohyets, which map equal precipitation levels, isopycnals help in understanding water column stability, mixing processes, and nutrient transport by illustrating density variations due to temperature and salinity changes. Their applications include modeling ocean circulation, studying climate patterns, and improving predictions of marine ecosystem responses.
Key Differences Between Isohyet and Isopycnal
Isohyets represent lines on a map connecting points of equal rainfall or precipitation, essential in meteorology for analyzing spatial distribution of rainfall. Isopycnals are contour lines that link points of equal density in fluid bodies, commonly used in oceanography and atmospheric science to study stratification and fluid dynamics. The key difference lies in their application domains: Isohyets map precipitation, focusing on hydrological data, whereas Isopycnals denote density layers crucial for understanding fluid stability and movement.
Methods of Drawing Isohyet Maps
Isohyet maps are created by plotting precipitation values collected from weather stations over a region and connecting points of equal rainfall using interpolation techniques like Thiessen polygons, inverse distance weighting, or kriging to achieve accurate spatial distribution. Digital elevation models and satellite data enhance isohyet mapping by providing detailed climatic and geographic context for refined contouring. This method contrasts with isopycnal mapping, which involves density measurements through tools like CTD sensors in oceanography, emphasizing the unique data sources and interpolation techniques specific to isohyet construction.
Techniques for Plotting Isopycnal Lines
Techniques for plotting isopycnal lines involve using density data obtained from oceanographic surveys or numerical models, where specific density values are contoured to represent surfaces of equal density in the water column. Methods such as interpolation between discrete measurements and applying algorithms like kriging or spline fitting enable the generation of smooth isopycnal surfaces, essential for visualizing stratification and mixing processes. Unlike isohyets that map precipitation intensity on geographic coordinates, isopycnals require vertical profiling data and three-dimensional plotting to capture density variations in oceanographic contexts accurately.
Importance of Isohyets in Meteorology
Isohyets represent lines connecting points of equal precipitation on weather maps, essential for analyzing spatial rainfall distribution and preparing accurate meteorological forecasts. They assist in identifying rainfall patterns, which is crucial for flood prediction, water resource management, and agricultural planning. Unlike isopycnals that denote surfaces of equal density in oceanography, isohyets specifically address atmospheric moisture variations, making them indispensable for understanding climate dynamics.
Significance of Isopycnals in Oceanography
Isopycnals are crucial in oceanography because they represent surfaces of equal density, enabling the study of ocean stratification and circulation patterns. Understanding isopycnal layers helps in analyzing water mass formation, mixing processes, and nutrient distribution in the ocean. Unlike isohyets, which map precipitation, isopycnals provide insights into the vertical and horizontal movement of ocean waters, essential for climate models and marine ecosystem assessments.
Real-world Examples: Isohyet vs Isopycnal
Isohyets are lines on weather maps connecting points of equal rainfall, commonly used in hydrology to analyze precipitation distribution in regions like the Amazon Basin or the Indian Monsoon zone. Isopycnals represent surfaces or lines of equal density in fluid dynamics, often applied in oceanography to study water column stratification, such as the thermocline layers in the North Atlantic Ocean. Both concepts are crucial for environmental modeling, with isohyets aiding in flood prediction and isopycnals helping understand ocean circulation patterns.
Summary: Choosing the Right Contour for Your Study
Isohyet maps display lines of equal precipitation, essential for hydrological and meteorological studies, while isopycnal maps represent surfaces of equal density, crucial in oceanography and fluid dynamics. Selecting isohyets benefits rainfall distribution analysis and watershed management, whereas isopycnals are ideal for understanding stratification and mixing in water bodies. Choosing the right contour depends on whether the focus is on atmospheric precipitation patterns or density-driven processes in fluids.
Isohyet Infographic