Isohel maps reveal patterns of sunshine duration, helping you understand solar exposure in different regions. These maps are vital for planning in agriculture, solar energy projects, and climate studies. Discover how Isohel analysis can optimize your decisions by reading the full article.
Table of Comparison
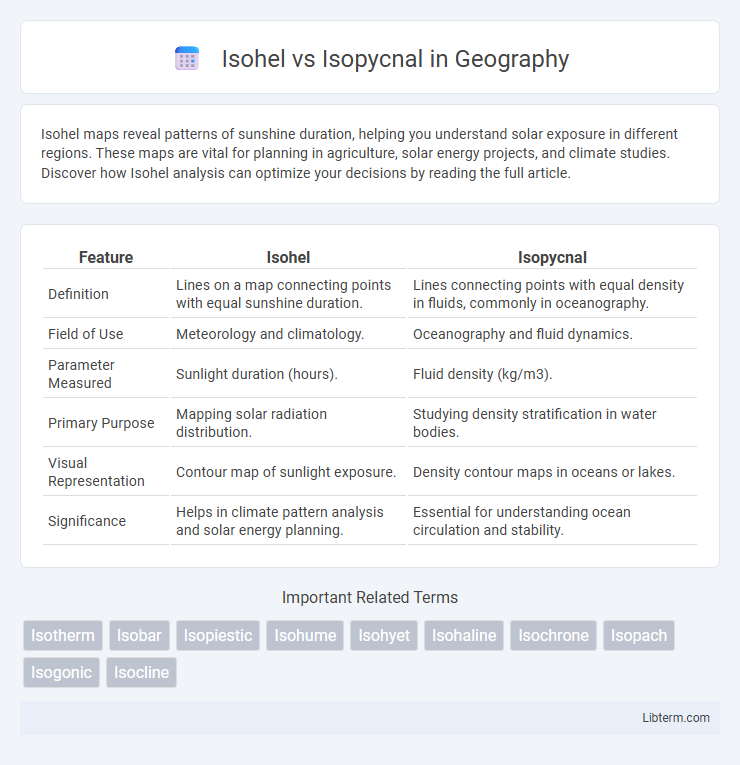
| Feature | Isohel | Isopycnal |
|---|---|---|
| Definition | Lines on a map connecting points with equal sunshine duration. | Lines connecting points with equal density in fluids, commonly in oceanography. |
| Field of Use | Meteorology and climatology. | Oceanography and fluid dynamics. |
| Parameter Measured | Sunlight duration (hours). | Fluid density (kg/m3). |
| Primary Purpose | Mapping solar radiation distribution. | Studying density stratification in water bodies. |
| Visual Representation | Contour map of sunlight exposure. | Density contour maps in oceans or lakes. |
| Significance | Helps in climate pattern analysis and solar energy planning. | Essential for understanding ocean circulation and stability. |
Introduction to Isohel and Isopycnal
Isohel lines represent points of equal sunlight intensity on the Earth's surface, mapping solar radiation patterns critical for climate and environmental studies. Isopycnal surfaces denote layers within a fluid where the density remains constant, playing a key role in oceanography and atmospheric sciences for understanding stratification and fluid dynamics. Both isohel and isopycnal concepts are essential in geosciences to analyze energy distribution and material properties in natural systems.
Defining Isohel
Isohel refers to a contour line on a weather map that connects points receiving equal sunlight or solar radiation, helping to analyze solar exposure patterns. Unlike isopycnal lines, which link points of equal water density important in oceanography, isohels focus specifically on solar radiation distribution. Understanding isohels aids in climate studies, solar energy assessments, and environmental modeling.
Defining Isopycnal
Isopycnal surfaces represent layers in a fluid where the density remains constant, playing a crucial role in oceanography and atmospheric science for understanding fluid dynamics and stratification. In contrast, isohels are contours of equal solar radiation or sunlight intensity mapped on Earth's surface, primarily used in climatology. Defining isopycnal layers helps in tracking the movement and mixing of water masses, as these surfaces often guide the flow and limit vertical mixing due to density stratification.
Key Differences Between Isohel and Isopycnal
Isohel lines represent equal sunlight intensity or solar radiation on the Earth's surface, essential for studying solar energy distribution and climatic patterns. Isopycnal lines, on the other hand, indicate areas of equal density in oceanography or atmospheric sciences, crucial for understanding fluid dynamics and stratification. The key difference lies in their application: Isohel relates to radiative heat and solar studies, while Isopycnal pertains to density-driven movement in fluids, impacting weather forecasting and ocean circulation models.
Applications of Isohel in Meteorology
Isohel maps in meteorology display contours of equal sunlight or solar radiation, aiding in the analysis of daylight distribution and solar energy potential. These maps help meteorologists assess cloud cover patterns, track solar irradiance variations, and optimize the placement of solar panels for renewable energy projects. Isohel data is crucial for climate modeling, weather forecasting, and understanding diurnal temperature changes influenced by solar radiation intensity.
Applications of Isopycnal in Oceanography
Isopycnal surfaces, representing layers of equal density, are essential in oceanography for understanding water mass movement and mixing processes. These surfaces help model ocean circulation by tracking the flow of water along density gradients, which is crucial for predicting climate patterns and nutrient transport. Unlike isohels, which map equal sunlight exposure, isopycnals provide critical insights into thermohaline circulation and stratification in ocean ecosystems.
Methods for Mapping Isohels
Mapping isohels involves analyzing solar radiation data using geospatial interpolation techniques such as kriging and inverse distance weighting to create smooth contour lines representing equal sunshine duration. Remote sensing instruments, including pyranometers and satellite-based sensors, provide high-resolution temporal and spatial measurements critical for accurate isohel mapping. Geographic Information Systems (GIS) integrate climatic and topographic data, enabling precise visualization and comparison of isohels with isopycnal surfaces in environmental and atmospheric studies.
Techniques for Identifying Isopycnals
Isopycnals are surface layers in fluids where the density remains constant, commonly identified using techniques such as CTD (Conductivity, Temperature, Depth) profiling, which measures seawater salinity and temperature to calculate density gradients accurately. Advanced remote sensing methods, including satellite altimetry and acoustic Doppler current profilers (ADCP), complement in situ measurements by mapping density-related properties over broader spatial scales. Numerical modeling and interpolation techniques further refine isopycnal surfaces by integrating observational data, aiding oceanographers in understanding stratification and mixing processes.
Importance in Environmental Science
Isohels, lines connecting points of equal solar radiation, play a critical role in environmental science by helping researchers analyze patterns of sunlight exposure affecting ecosystems and climate models. Isopycnals, contours representing equal water density, are essential for studying ocean stratification, nutrient distribution, and the mixing processes that influence marine biodiversity and carbon cycling. Understanding both isohels and isopycnals enables scientists to predict environmental changes with greater accuracy, enhancing conservation strategies and climate resilience efforts.
Comparing Isohel and Isopycnal in Data Analysis
Isohel and isopycnal both represent contour lines used in spatial data analysis, but they serve different purposes: isohel maps illustrate equal solar radiation or sunshine duration, while isopycnal lines connect points of equal density, often in oceanographic or atmospheric datasets. Comparing isohel and isopycnal data involves examining solar insolation patterns against density stratification, which can reveal correlations between solar heating and fluid density variations in environmental studies. Accurate interpretation of these contour types enhances understanding of solar energy distribution and tracking density-driven processes in climate and marine science analyses.
Isohel Infographic