Isohaline environments maintain a constant salinity level, crucial for studying aquatic ecosystems and marine species adaptation. Understanding the dynamics of isohaline zones can help you predict changes in water chemistry and their impact on biodiversity. Explore the full article to learn how isohaline conditions influence marine life and water quality.
Table of Comparison
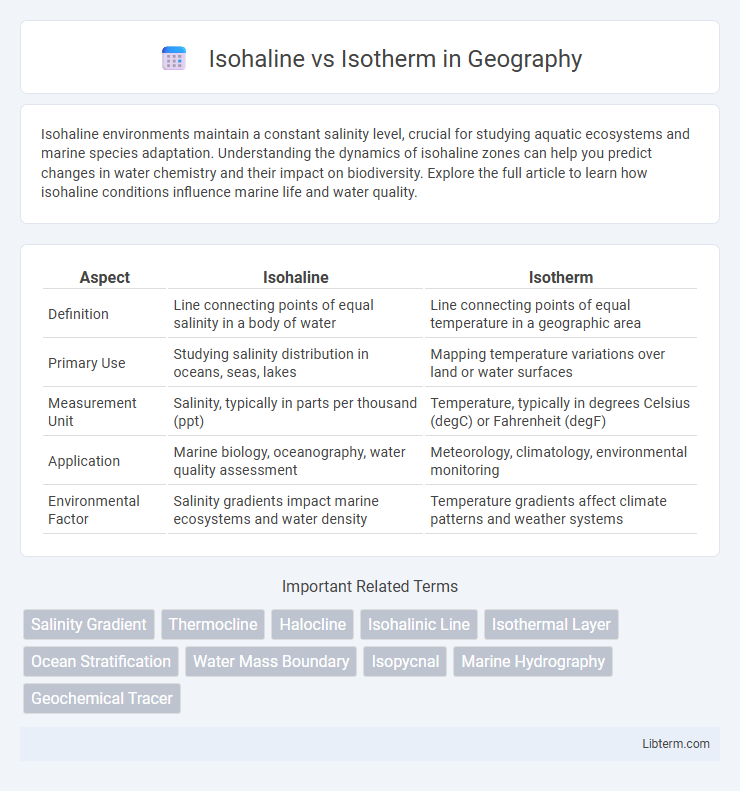
| Aspect | Isohaline | Isotherm |
|---|---|---|
| Definition | Line connecting points of equal salinity in a body of water | Line connecting points of equal temperature in a geographic area |
| Primary Use | Studying salinity distribution in oceans, seas, lakes | Mapping temperature variations over land or water surfaces |
| Measurement Unit | Salinity, typically in parts per thousand (ppt) | Temperature, typically in degrees Celsius (degC) or Fahrenheit (degF) |
| Application | Marine biology, oceanography, water quality assessment | Meteorology, climatology, environmental monitoring |
| Environmental Factor | Salinity gradients impact marine ecosystems and water density | Temperature gradients affect climate patterns and weather systems |
Introduction to Isohalines and Isotherms
Isohalines represent lines of equal salinity in oceanographic maps, essential for studying salt concentration distribution and its effects on marine ecosystems. Isotherms, on the other hand, are lines of equal temperature that help analyze thermal patterns and heat distribution in aquatic environments. Both Isohalines and Isotherms provide critical data for understanding ocean circulation, climate change, and habitat conditions in marine science.
Defining Isohalines: Meaning and Importance
Isohalines represent lines or contours on a map that connect points of equal salinity, playing a crucial role in oceanography and marine studies by illustrating variations in salt concentration within bodies of water. Understanding isohalines helps monitor seawater mixing, water mass formation, and ecosystem health, providing valuable insights into marine biodiversity and climate change effects. Unlike isotherms, which track temperature, isohalines specifically focus on the spatial distribution of salinity, essential for studying ocean circulation and salinity-driven density differences.
Understanding Isotherms: Definition and Significance
Isotherms are lines on maps that connect points of equal temperature, playing a crucial role in meteorology and climatology for visualizing temperature distribution and patterns. They help in understanding weather forecasts, climate zones, and oceanic temperature gradients by illustrating how temperature varies spatially. Unlike isohalines, which connect points of equal salinity, isotherms specifically focus on thermal conditions, aiding in the analysis of atmospheric and environmental temperature changes.
Key Differences Between Isohaline and Isotherm
Isohaline lines represent constant salinity levels in bodies of water, often used in oceanography and marine studies to map salt concentration, while isotherms are lines indicating constant temperature values on weather maps and climate studies. The primary difference lies in their measured parameters: isohalines track salinity (measured in parts per thousand, ppt), whereas isotherms track temperature (measured in degrees Celsius or Fahrenheit). Isohalines are crucial for understanding marine ecosystems and water mass properties, whereas isotherms are vital for meteorological analysis and temperature pattern visualization.
Methods for Mapping Isohalines and Isotherms
Mapping isohalines involves collecting salinity data from water samples across different spatial points, often using conductivity sensors or salinometers, followed by interpolation techniques such as kriging or inverse distance weighting (IDW) to create continuous salinity contour lines. Isotherm mapping relies on temperature measurements obtained from thermometers, satellite remote sensing, or buoy networks, with spatial interpolation methods applied similarly to generate temperature contour maps. Geographic Information Systems (GIS) and specialized software like MATLAB or ArcGIS are commonly used in both methods to process data and visualize isohalines and isotherms for oceanographic and climatological studies.
Applications of Isohalines in Oceanography
Isohalines, lines connecting points of equal salinity, are crucial in oceanography for mapping salt concentration gradients and studying water mass distribution. They help identify ocean circulation patterns, monitor estuarine mixing, and assess the impacts of freshwater input on marine ecosystems. Isohalines provide essential data for understanding salinity-driven density variations that influence ocean stratification and climate modeling.
Uses of Isotherms in Climate Studies
Isotherms play a crucial role in climate studies by mapping temperature distributions across geographic regions, enabling the analysis of climate zones and seasonal temperature variations. They assist meteorologists in predicting weather patterns and assessing the impacts of climate change on ecosystems. Unlike isohalines, which represent salinity gradients in oceans, isotherms provide vital data for understanding atmospheric temperature trends and global warming effects.
Common Challenges in Interpreting Isohalines and Isotherms
Interpreting isohalines and isotherms presents challenges such as spatial variability and temporal fluctuations that affect accurate mapping of salinity and temperature gradients. Measurement inaccuracies and environmental heterogeneity often lead to ambiguous delineation of these contour lines, complicating data correlation and oceanographic modeling. Understanding these difficulties is crucial for precise marine environment assessments and effective management of aquatic ecosystems.
Recent Advances in Isohaline and Isotherm Analysis
Recent advances in isohaline and isotherm analysis have leveraged high-resolution satellite data and machine learning algorithms to enhance the precision of salinity and temperature mapping in marine environments. Enhanced sensor technology enables real-time monitoring of isohalines and isotherms, providing critical insights into ocean stratification, climate change effects, and marine ecosystem dynamics. Improved computational models now integrate these datasets to predict ocean circulation patterns and contribute to more accurate climate forecasting.
Conclusion: Isohaline vs Isotherm in Environmental Science
Isohaline lines represent areas of equal salinity while isotherms indicate regions of equal temperature, both crucial for analyzing marine and atmospheric processes in environmental science. Understanding the spatial distribution of isohalines aids in assessing ocean circulation and salinity-driven ecosystems, whereas isotherms are essential for studying climate patterns and thermal gradients. Combining isohaline and isotherm data provides a comprehensive view of environmental conditions, enabling better predictions of ecological responses to changing oceanographic and atmospheric variables.
Isohaline Infographic